


America 250: A Historic Celebration with Major Travel Impacts
America 250 marks the 250th anniversary of the signing of the Declaration of Independence, a nationwide commemoration planned for 2026. With major events expected in historic and cultural destinations, this celebration is shaping up to be one of the biggest travel years in U.S. history. From parades and festivals to large-scale community gatherings, the ripple effect is already visible in vacation rental booking patterns for the July 4th holiday week, a period that will be at the heart of the festivities.
Occupancy Pacing: America 250 Boosts Early Bookings in Select Markets
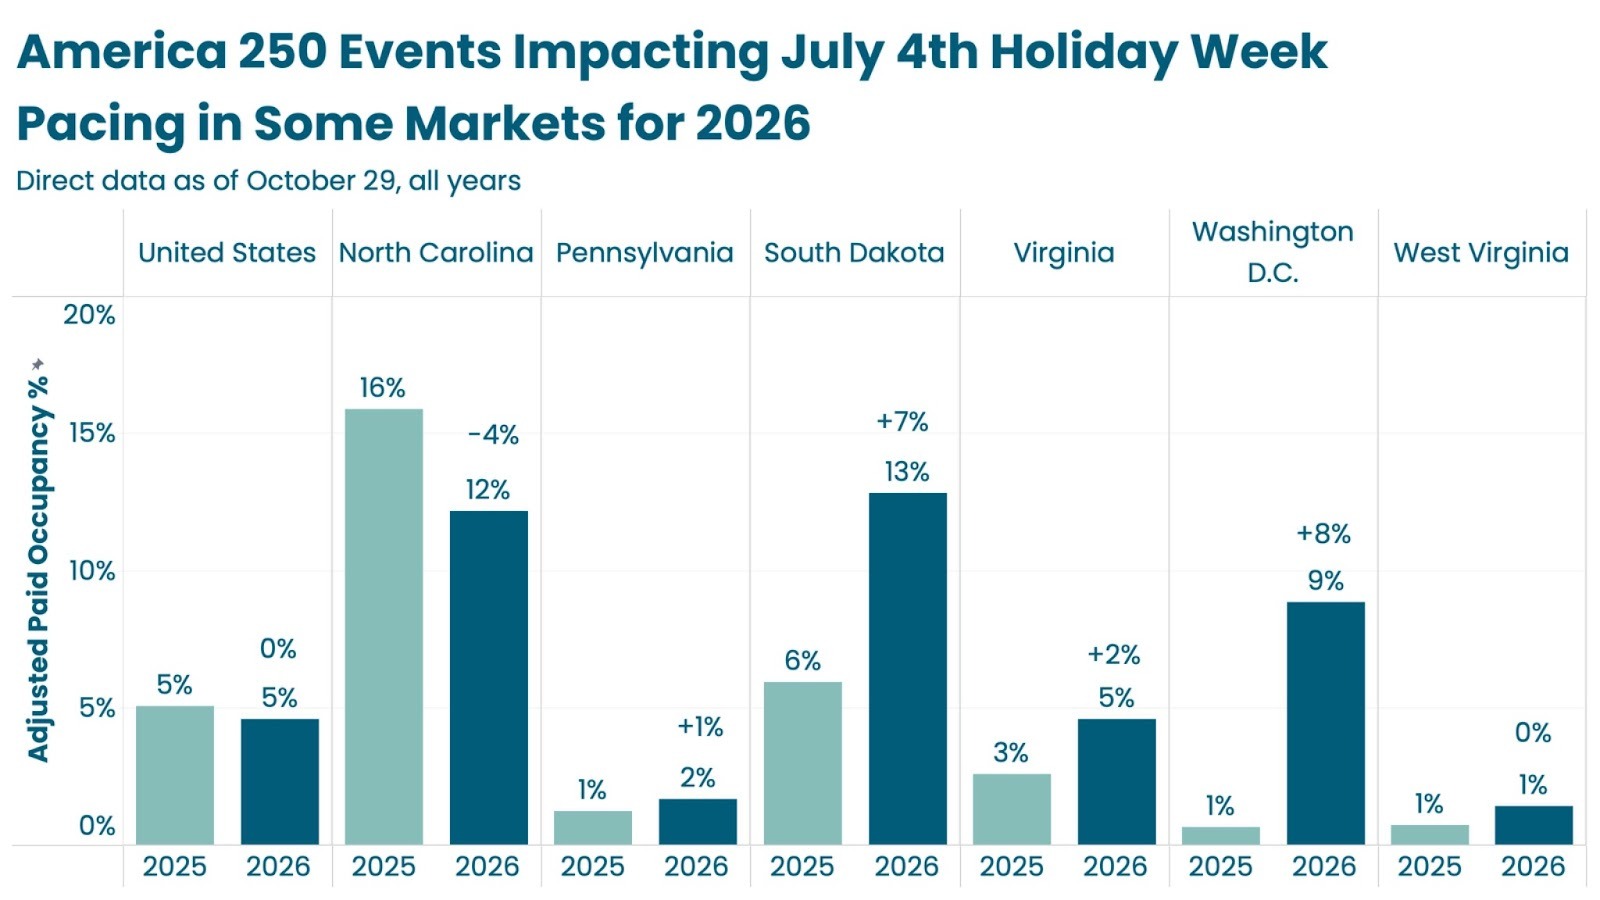
Adjusted Paid Occupancy = Nights Sold / (Total Nights - Owner Nights - Hold Nights)
Key Data’s direct performance data (as of October 29) shows that adjusted paid occupancy pacing for July 4th week 2026 is already reflecting the early influence of America 250 events. While the U.S. overall remains steady at 5%, several historically significant regions are seeing a surge in early bookings. South Dakota, for example, has seen occupancy pacing rise from 6% in 2025 to 13% in 2026, a gain of seven percentage points, suggesting that travelers are locking in reservations near national parks and event hubs earlier than usual. Similarly, Washington, D.C., which will serve as the symbolic center of the America 250 celebrations, is reporting an 8% increase, climbing to 9% occupancy pacing year-over-year.
Other heritage-driven destinations such as Virginia are also benefiting from the growing national excitement, with occupancy pacing up two points to 5%. Meanwhile, North Carolina, despite a slight dip of four percentage points from 16% to 12%, still demonstrates robust demand following a strong 2025 pacing performance. Pennsylvania has inched upward as well, improving from 1% to 2% occupancy pacing. Collectively, these trends show that traveler behavior is shifting toward early planning in anticipation of once-in-a-generation events.
In 2026, the average booking window (ABW) nationally sits at 331 days, nearly identical to 2025’s 330, showing that travelers continue to plan nearly a year out for major holidays. Washington, D.C. stands out again with a 19% increase in booking lead time, now averaging 333 days, as guests secure accommodations early to be near large-scale national events. Meanwhile, most other markets remain stable or slightly down, including South Dakota (-6%), Virginia (-3%), and West Virginia (-3%), suggesting steady booking behavior despite growing demand.
For property managers and destination marketing organizations (DMOs), these metrics highlight that early engagement is key. Markets showing both rising occupancy and extended booking windows should begin targeted campaigns now; focusing on event-driven messaging and flexible rate strategies to capture high-value bookings well ahead of 2026.
ADR Trends: Rates Lagging Despite Rising Demand
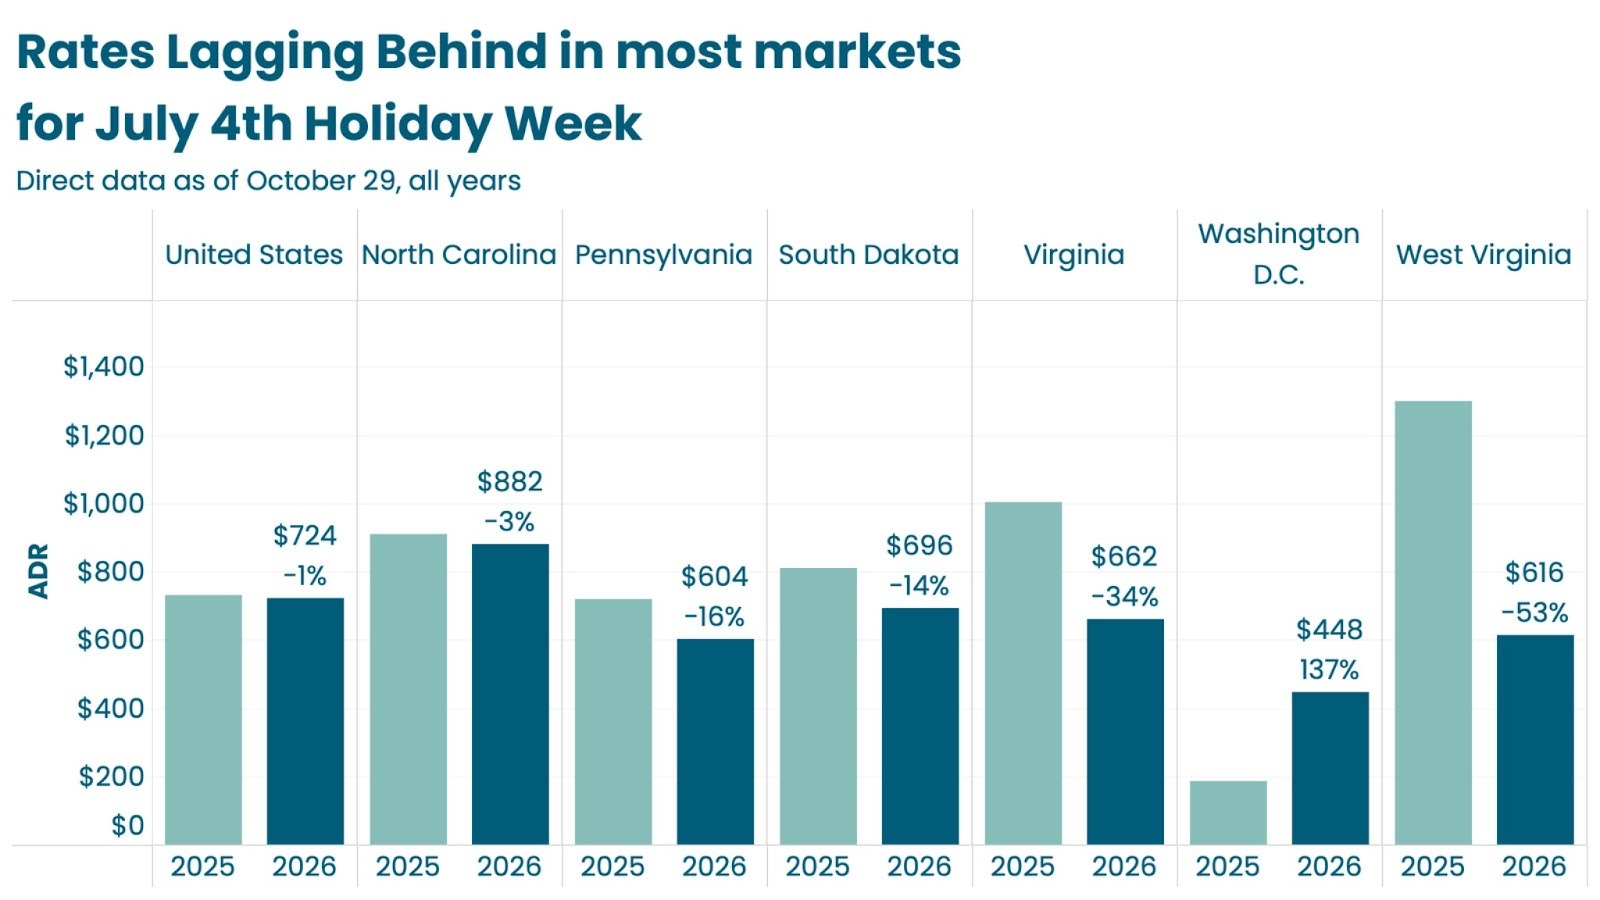
Average Daily Rate (ADR) = Unit Revenue / Nights Sold
While occupancy pacing is strengthening in several markets, average daily rates (ADR) for July 4th 2026 are showing mixed momentum across the country. National ADRs are down slightly by 1% year-over-year, averaging $724, suggesting that rate adjustments haven’t yet caught up with the rising traveler demand. North Carolina shows a 3% decline to $882, and South Dakota fell 14% to $696, as managers cautiously hold back on rate increases despite higher bookings. Virginia saw a steeper 34% drop to $662, likely tied to early-season discounts or cautious pricing amid a soft 2025 comparison, while Pennsylvania dipped 16% to $604.
West Virginia, however, experienced the sharpest ADR decline of all measured markets, down 53% year-over-year to $616, a sign that while the market is beginning to attract more bookings, pricing strategies may not yet be optimized to capture peak July 4th demand. On the other end of the spectrum, Washington, D.C. stands out with a 137% surge to $448, reflecting the power of event-driven pricing in high-demand, limited-supply markets.
Despite weaker rate pacing in many areas, Adjusted RevPAR tells a more balanced story. Revenue growth is being fueled by rising occupancy in several states, including South Dakota and Washington, D.C., both translating early demand into stronger revenue per available rental. Virginia (+17%) and West Virginia (+65%) are also showing signs of rebound potential as occupancy gains begin to offset lower ADRs. These mixed results emphasize that while occupancy growth is helping to lift overall performance, property managers must stay focused on finding the right balance between occupancy and rate to maximize total revenue, not just fill nights.
Traveler Behavior: Stay Length Patterns Shift Ahead of 2026
Traveler behavior data shows a nuanced pattern heading into 2026. Across the United States, average stay length holds steady at 7.6 nights, unchanged from 2025. Some states, however, are showing significant shifts. Washington, D.C. saw a steep 33% decline to 4.7 nights, likely reflecting shorter, event-driven stays as travelers center trips around specific America 250 activities rather than full-week vacations. Virginia and West Virginia also shortened notably, with stays pacing 12% and 26% shorter, respectively.
By contrast, South Dakota and North Carolina maintained or slightly increased their average stay lengths, with guests staying around 4.8 and 8.1 nights, respectively. These regions could see longer stays tied to family travel and national park tourism as part of celebratory road trips. The mixed trends indicate a diverse traveler intent, some seeking immersive historical experiences, others opting for short-event visits.
For DMOs and property managers, understanding these shifts will be crucial for marketing and operations planning. Destinations seeing shorter stays may need to focus on turnover efficiency and flexible booking policies, while longer-stay markets can emphasize extended-stay discounts or packages tailored for multi-day event travelers.
What This Means for Property Managers and DMOs
1. Focus on Revenue, Not Just Occupancy
While RevPAR growth in several markets is being driven by higher occupancy, it’s crucial for property managers to remember that maximizing revenue, not simply filling nights, is the ultimate goal. A surge in bookings can mask underperforming rates, so striking the right balance between ADR and occupancy is key. Property managers should use data-driven pricing strategies to capture increased demand without eroding rate integrity. By continuously monitoring occupancy pacing, ADR shifts, and RevPAR performance, operators can fine-tune pricing to ensure they’re optimizing total revenue, not just volume.
2. Market Early, Market Smart
With booking windows exceeding 11 months in many markets, there’s still a valuable runway to attract travelers. DMOs should begin integrating America 250 messaging into destination content and campaigns now, while property managers focus on seasonal visibility and loyalty-driven rebooking.
3. Leverage Data to Stay Ahead
Using real-time data from Key Data’s dashboards enables property managers to track pacing trends, spot opportunities, and forecast more accurately as America 250 approaches. Staying informed about occupancy, ADR, and RevPAR in context will help ensure strategies remain agile and profit-focused.
A Once-in-a-Generation Opportunity
America 250 is not just a commemoration, it’s a catalyst for tourism growth. For vacation rental managers and DMOs, the July 4th 2026 holiday week presents a unique chance to capture traveler enthusiasm tied to America’s semiquincentennial.
Understanding where occupancy and ADR trends are diverging will be key. As Key Data’s early insights show, success in 2026 will hinge on timely strategy, flexible pricing, and strong destination storytelling.