


As FIFA 2026 approaches, early booking data is already revealing shifts in where demand is forming and why. Analyzing feeder market performance across East and West Coast host cities shows that geography is playing a decisive role in shaping travel behavior.
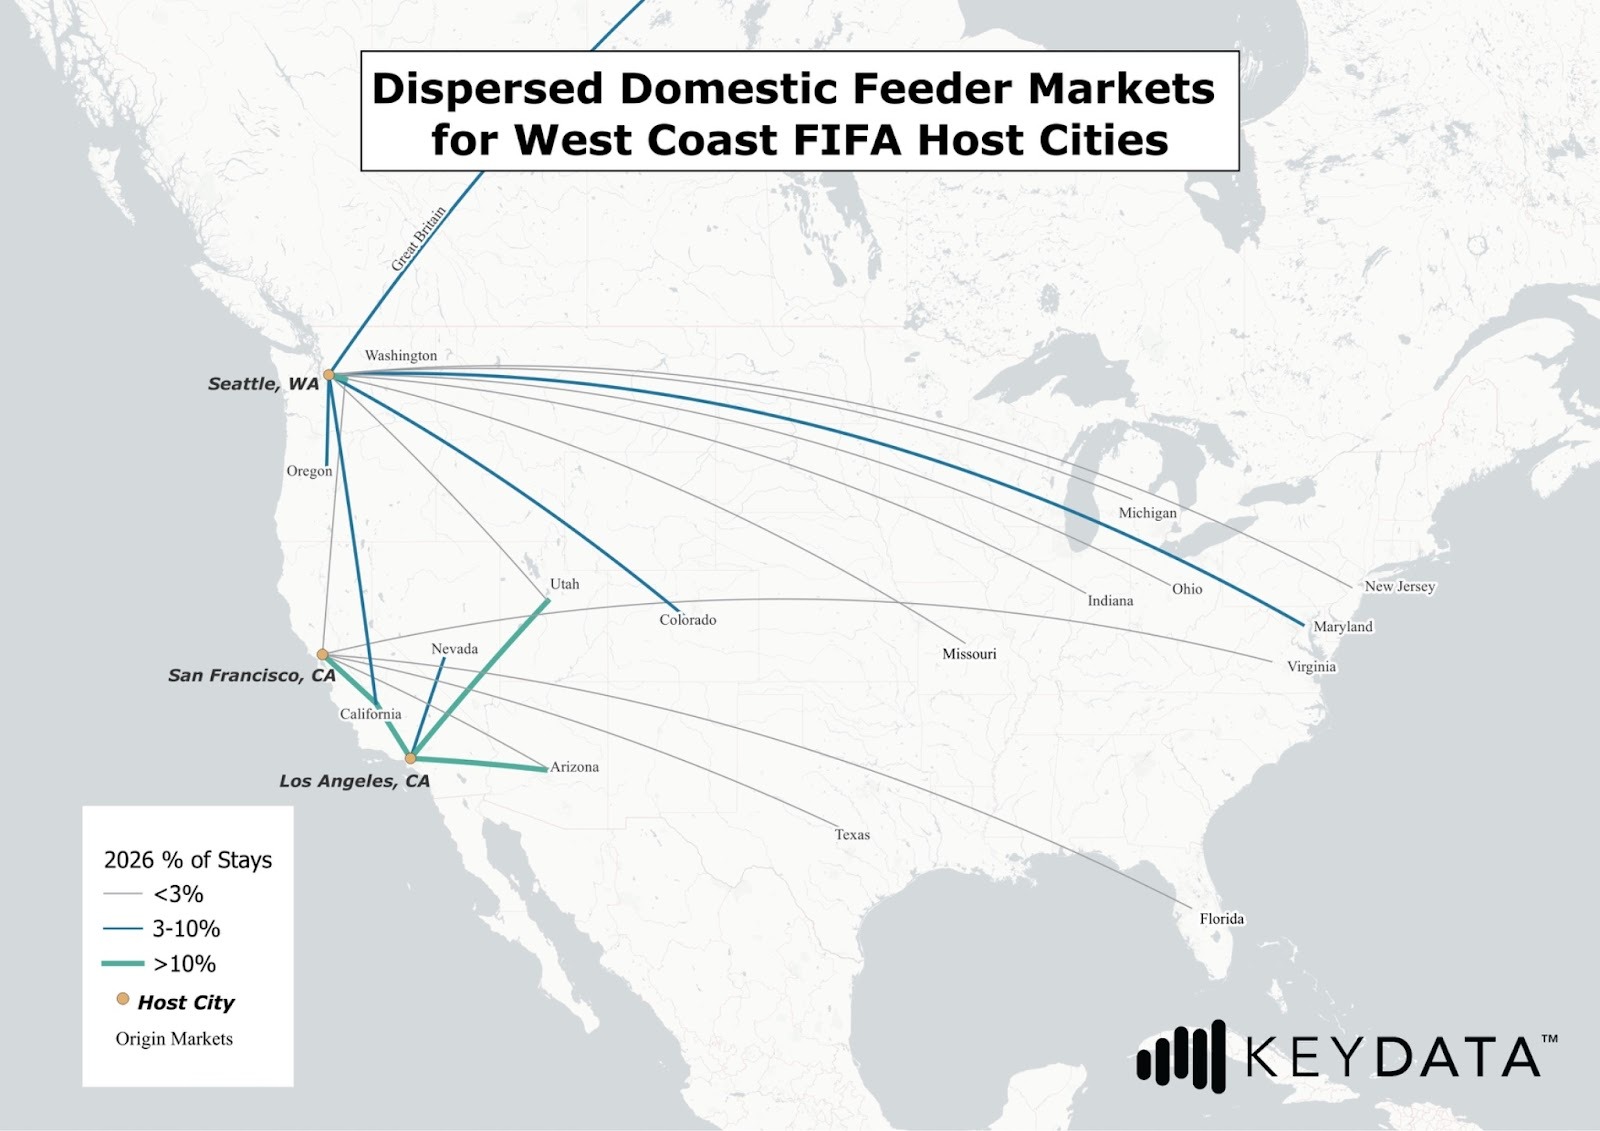
Feeder market visualizations reinforce this pattern. The maps illustrate where travelers are coming from, with lines representing contributing markets and thickness indicating their share of total stays. For West Coast hosts, like Los Angeles, San Francisco, and Seattle, the network spans the entire United States. However, most markets contribute relatively small shares, typically between 1–5% of stays, with only a few exceeding 5–10%.
This dispersion signals an important structural shift. Rather than concentrated cross-country travel, domestic demand for West Coast markets appears broadly distributed and increasingly regional. With several FIFA host cities now located closer to large East Coast population centers, many travelers who might historically fly west can attend matches nearer to home. In other words, demand is not simply growing, it is redistributing.
East Coast: International Access and Longer Stays
Among East Coast hosts, the New York City metro area shows the strongest structural momentum. Weighted year-over-year stay growth is pacing approximately 15.7% ahead, ADR has increased +9.4%, and average length of stay has expanded nearly +30%. That combination, more bookings, higher nightly rates, and significantly longer trips, suggests visitors are building extended itineraries around the tournament rather than making short event-only visits.
Miami, FL displays a different demand profile. Stay growth is positive at roughly 4.5%, while ADR has climbed sharply by about 27%. At the same time, average length of stay has declined -14%, indicating more concentrated trips. Visitors appear willing to pay higher nightly rates but are staying fewer nights, pointing to high-value, event-focused travel.
Boston shows a more price-sensitive pattern. Stay growth is around +6%, but ADR has declined significantly (approximately -34%) and average length of stay is down -25%. This suggests Boston may be stimulating early demand through pricing rather than relying on premium compression at this stage of the booking cycle.
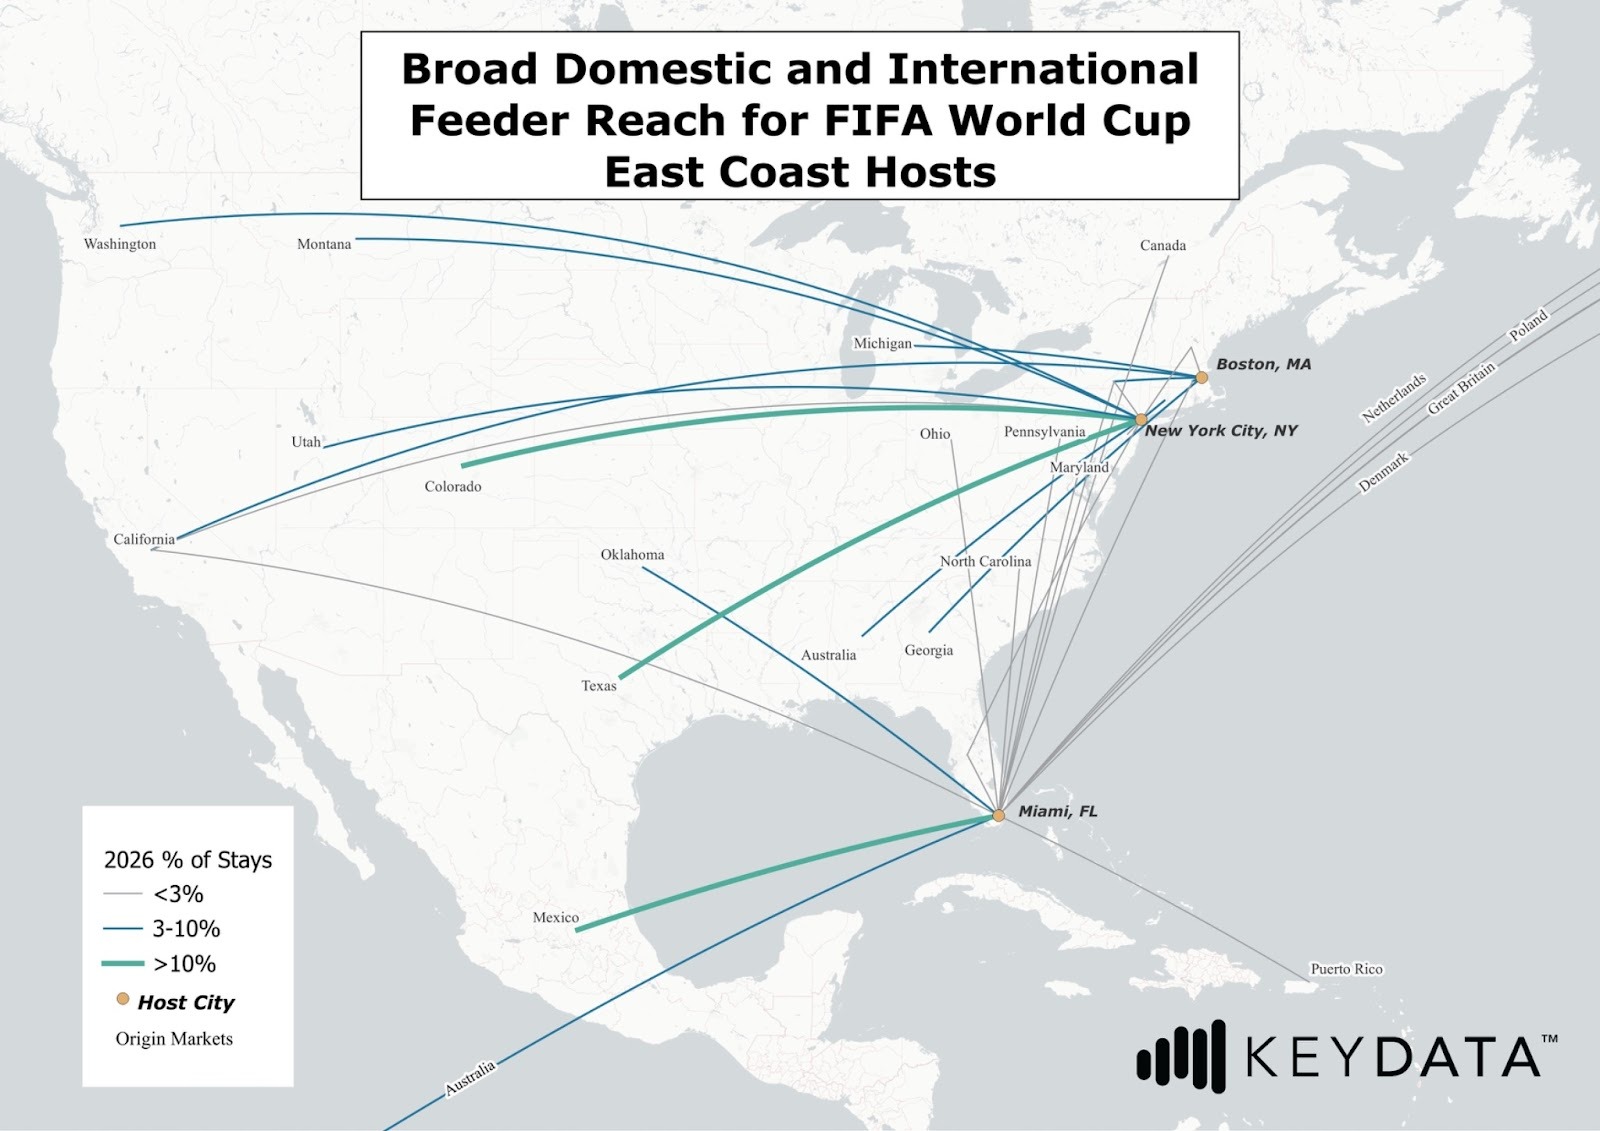
Beyond individual market performance, East Coast hosts share a structural advantage: international accessibility. Shorter transatlantic flight times, greater direct route availability, and favorable time-zone alignment make cities like New York, Boston, and Miami easier entry points for travelers from Europe and parts of South America.
The feeder visualization reflects this advantage, with lines extending across both domestic and international markets. Reduced travel friction increases the likelihood that overseas visitors will begin their tournament itineraries on the East Coast, suggesting these markets may capture a larger share of international stays.
West Coast: Premium Strength in San Francisco
On the West Coast, the San Francisco Bay Area stands out as the strongest early performer. Stay growth is pacing roughly +42% year-over-year, ADR has surged by approximately +86%, and average length of stay has increased about +6%.
Simultaneous expansion in volume, rate, and trip duration is rare. This pattern suggests early premium positioning and long-haul demand entering the market with limited resistance to higher prices.
Los Angeles and Seattle: A More Regional Demand Base
The patterns in Los Angeles and Seattle look different. Greater Los Angeles currently shows an 18% year-over-year stay decrease, with ADR down 7% and average length of stay down about 5%. Seattle shows similar softening, with stays down roughly 9%, ADR down 14%, and length of stay down 13%.
Part of this dynamic may reflect changing domestic travel patterns. In previous event cycles, East Coast travelers often flew cross-country to attend marquee events in West Coast cities. With FIFA 2026 matches distributed across both coasts, many of those travelers now have host cities much closer to home.
The feeder visualization supports this interpretation. While West Coast demand extends across the country, the largest stay contributions tend to originate from nearby Western states. Rather than relying heavily on long-haul domestic trips, these markets appear increasingly supported by regional travel corridors.
In effect, the broader geographic footprint of FIFA 2026 is regionalizing domestic travel. Visitors are more likely to attend matches in host cities closer to home rather than flying across the country. This shift does not necessarily indicate weaker overall demand for West Coast cities. Instead, it reflects geographic efficiency: when comparable events are closer, travelers choose proximity.
The Structural Shift
FIFA 2026 is not creating uniform demand across host cities. Instead, it is amplifying existing geographic advantages.
East Coast markets benefit from international proximity and strong regional domestic access. West Coast markets, particularly San Francisco, show strong premium positioning but may see less cross-country domestic flow as travelers opt for closer host cities.
Demand, in short, is not just increasing, it is reorganizing. Operators who recognize these geographic and behavioral shifts early, and align pricing, segmentation, and distribution strategies accordingly, will be best positioned as global booking momentum accelerates in the lead-up to the tournament.