
.png)


The July 4th holiday weekend is one of the most important demand indicators for the U.S. short-term rental industry, and the 2026 pacing points to continued strength across vacation rental markets nationwide. KeyData analyzed short-term rental pacing performance across 25 U.S. markets, comparing the Friday–Monday holiday window in 2026 (July 3–6) against the equivalent Friday–Monday holiday period in 2025 (July 4–7). By aligning the analysis to the same days of the week rather than identical calendar dates, the comparison more accurately reflects true year-over-year travel demand and booking behavior.
Key Takeaways
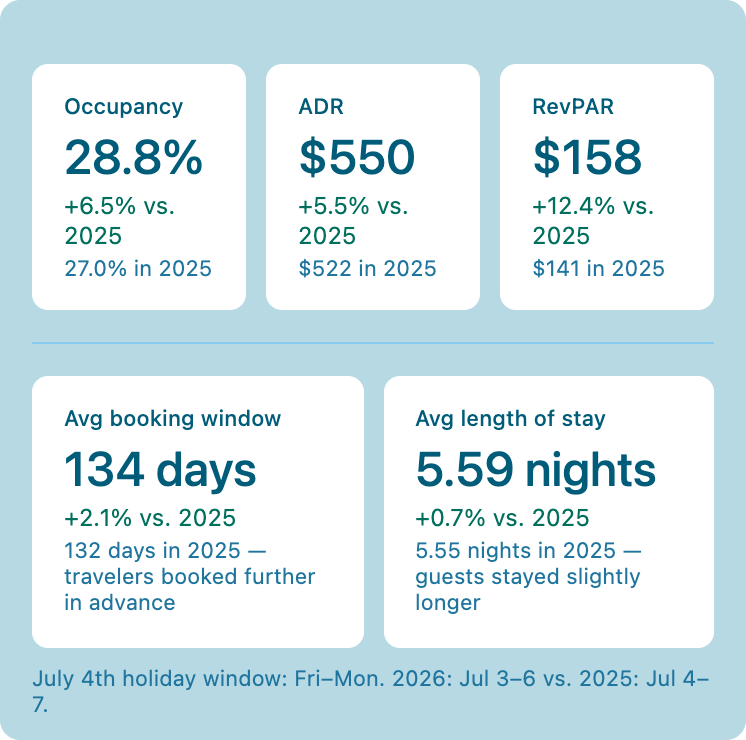
- National occupancy is pacing up 6.5% year over year during the July 4th holiday weekend.
- ADR is 5.5% aheadnationally, driving a 12.4% increase in RevPAR.
- Travelers are booking 2.1% earlier than in 2025.
- Average length of stay is pacing slightly longer, going from 5.55 nights to 5.59 nights.
- Twenty-two of the 25 markets analyzed are seeing positive RevPAR growth.
National July 4th Performance Trends
At the national level, short-term rental demand is remaining strong throughout the July 4th holiday period. Occupancy growth of 6.5% indicates that a meaningfully larger share of available inventory is booked at the moment compared to the same holiday weekend in 2025. At the same time, average daily rate (ADR) is up 5.5% year over year, demonstrating that operators are maintaining pricing power during one of the highest-demand travel periods of the summer season.
Together, those gains are producing a 12.4% increase in RevPAR nationally, signaling that both demand growth and pricing contribute to stronger overall revenue performance. Importantly, the growth is broad-based rather than isolated to a small group of markets. Coastal destinations, drive-to regional markets, mountain regions, and interior leisure markets are all seeing overall performance improvement.
The results reinforce a broader trend that is continuing throughout the post-pandemic travel environment: leisure travel demand remains resilient, particularly during peak seasonal travel periods where consumers continue prioritizing destination-oriented experiences.
Travelers Are Booking Earlier and Staying Longer
Behavioral metrics also are also improving during the holiday weekend and provide additional context around traveler confidence heading into the remainder of the summer season.
Nationally, the average booking window is up 2.1% year over year, rising from 131.5 days in 2025 to 134.2 days in 2026. Travelers are booking holiday trips slightly further in advance, suggesting stronger trip-planning confidence and earlier decision-making compared to the prior year.
Average length of stay (ALOS) is also increasing modestly from 5.55 nights to 5.59 nights, a 0.7% gain year over year. While relatively small, the increase reinforces that travelers continue prioritizing multi-night leisure trips during peak summer travel periods.
For property managers and revenue managers, these trends are particularly important because longer booking windows improve forward demand visibility while stable or increasing stay lengths help support occupancy compression and operational efficiency during high-demand periods.
New England and Mid-Atlantic Markets Lead Growth
Several regional and coastal markets significantly are outperforming national averages during the holiday period.
Mid-Atlantic States are recording the strongest occupancy growth in the dataset, with occupancy increasing 19.5% year over year. Combined with ADR growth of 5.6%, the region is showing a 26.2% increase in RevPAR. Worcester County, Maryland is also showing a strong performance with occupancy growth of 10.7% and RevPAR growth of 23.1%.
New England is emerging as one of the strongest-performing regions from both a revenue and behavioral standpoint. The market is experiencing an 18.1% increase in RevPAR while also recording the largest increase in booking window among all markets analyzed. Travelers are booking 14.7% further in advance than they did in 2025, while average length of stay is increasing 6.7%.
These results suggest travelers are showing particularly strong confidence in Northeast and Mid-Atlantic leisure destinations during the holiday weekend, especially among traditional summer drive-to markets.
Florida and Regional Leisure Markets Continue to Outperform
Florida vacation rental markets also continue to show strong demand performance. Osceola County is showing some of the strongest overall pacing results in the dataset with RevPAR growth of 27.9%, driven by occupancy growth of 7.9% and ADR growth of 18.6% — the largest ADR increase among all markets analyzed.
Bay County, Florida is pacing 19.3% higher in RevPAR, supported by a 15.2% increase in occupancy, while Walton County and Okaloosa County are each showing RevPAR growth of approximately 13.5%.
Beyond coastal destinations, interior regional markets are also performing exceptionally well. The Midwest U.S. is leading all markets with a 29.9% increase in RevPAR, driven by occupancy growth of 16.4% and ADR growth of 11.7%. Central States are showing a 24.5% increase in RevPAR supported by strong gains in both occupancy and pricing.
The breadth of outperformance across the pacing of so many market types highlights the continued strength of U.S. leisure travel demand heading into the summer season.
Booking Behavior Is Varied Across Markets
While national booking trends are improving overall, some destinations are seeing meaningful shifts in traveler behavior.
U.S. Territories are seeing one of the largest booking window compressions in the dataset, with booking windows declining 27.5% year over year. Average length of stay is also down 23.3%. Eagle County, Colorado is seeing similar patterns, with booking windows shortening 11.8% and average length of stay declining 22.8%.
Despite those behavioral changes, both markets are still seeing positive RevPAR growth. These trends suggest travelers are remaining willing to spend on leisure travel, but booking behavior continues to become more dynamic and selective in certain destination types.
For revenue managers, shorter booking windows can create more volatile pacing trends and increase the importance of maintaining disciplined pricing strategies deeper into the booking cycle.
Only Three Markets Are Seeing RevPAR Declines
Only three of the 25 markets analyzed are pacing to experience RevPAR declines during the holiday weekend: Dare County, North Carolina; Horry County, South Carolina; and the Hawaiian Islands.
Dare County is down 1.3% year over year as occupancy softness offset ADR growth, though the market is still maintaining the highest occupancy level in the dataset at 59.1%. Horry County is showing a 2.0% decline in RevPAR driven primarily by lower occupancy.
The Hawaiian Islands are recording the largest RevPAR decline at 3.7% and stood apart as the only market where ADR is also declining year over year, signaling weaker pricing power relative to other leisure destinations during the holiday period.
What Property Managers Should Watch Heading Into Summer
The July 4th holiday weekend pacing data is reinforcing the continued resilience of U.S. short-term rental demand. Occupancy growth, ADR growth, longer booking windows, and stable stay lengths all point toward a healthy leisure travel environment entering the summer season.
At the same time, the data also highlights the increasingly localized nature of demand performance. Some markets are seeing earlier booking behavior and longer stays, while others are experiencing compressed booking windows and more dynamic pacing trends.
For property managers and revenue managers, success increasingly depends on localized market intelligence, agile revenue management strategies, and the ability to respond quickly to evolving traveler behavior. Markets with strong regional demand drivers, flexible accommodations, and sustained leisure appeal appear particularly well-positioned heading into the remainder of 2026.