


December 2025 — The release of the FIFA World Cup 2026 match schedule on December 5th triggered an immediate and substantial booking surge across North American host cities, with vacation rental data showing year-over-year increases exceeding 1,000% in several markets for the tournament period (June 11 - July 19, 2026).
Schedule Announcement Creates Immediate Impact
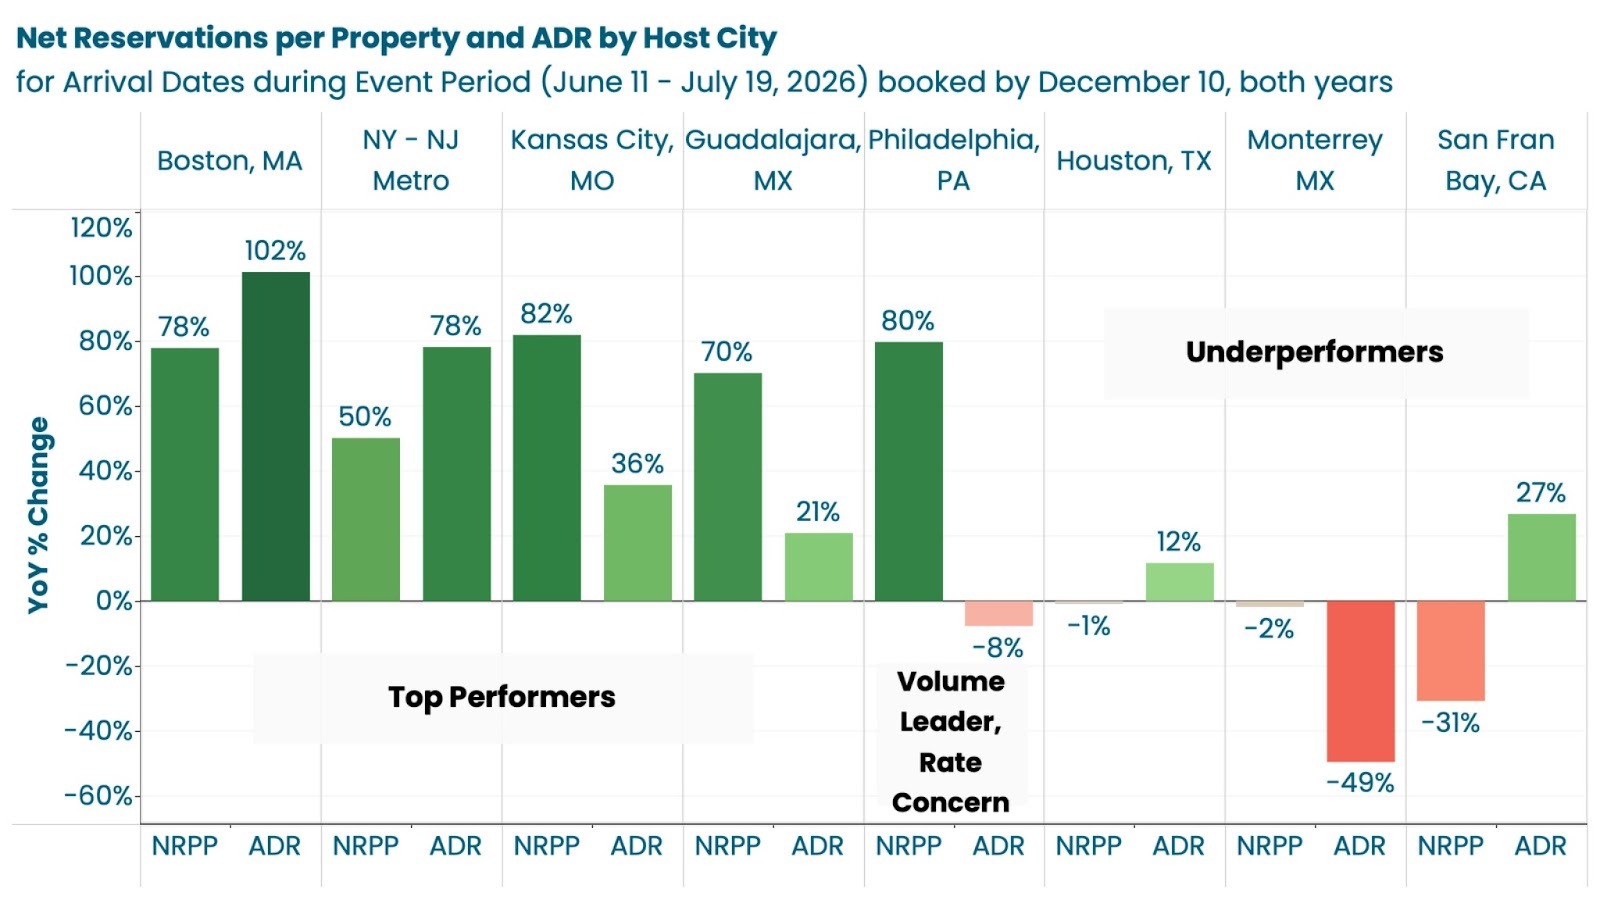
The week of December 1-7, 2025 saw host cities collectively post an average +29% increase in net reservations per property compared to the same week in 2024, with 13 of 16 host markets showing positive year-over-year growth. Average daily rates (ADR) jumped +25% across all markets, with 13 of 16 cities commanding higher rates.
Booking Week Winners
Kansas City emerged as the breakout market during the schedule release week, posting the strongest lift with:
- Net reservations per property: +82% YoY
- Available booking window (ABW): +137% YoY
- ADR: +36% YoY
Greater Philadelphia and Greater Boston followed closely behind with +80% and +78% reservation increases, respectively. Boston particularly impressed with a +102% ADR increase, signaling exceptional pricing power.
Guadalajara (+70% reservations) and New York metro (+50% reservations, +78% ADR) round out the top five booking-week performers.
Markets Showing Caution
Not all markets captured immediate momentum. San Francisco Bay Area posted the only material decline in net reservations per property (-31% YoY), despite ADR increasing +27%. Monterrey showed flat reservations with a concerning -49% ADR decline, while Greater Houston remained essentially unchanged on volume metrics.
Event Period: Explosive Growth in Key Markets
When examining the actual event weeks (June 11 - July 19, 2026), the data reveals extraordinary year-over-year growth in select markets. Across all cities and event weeks, the average metrics show:
- Nights sold: +298% YoY
- Revenue per property: +533% YoY
- ADR: +63% YoY
- RevPAR: +552% YoY
- Paid occupancy: +274% YoY
The Hyper-Demand Markets
Five cities stand out as experiencing genuine high-demand during the tournament:
Guadalajara (Mexico)
- Reservations per property: +1,989% YoY (nearly 20x growth)
- Revenue per property: +2,034% YoY
- ADR: +142%
- Paid occupancy: +754%
Greater Boston
- Reservations per property: +1,954% YoY
- Revenue per property: +725% YoY
- Paid occupancy: +598% YoY
Kansas City, MO
- Reservations per property: +1,271% YoY
- Revenue per property: +3,841% YoY (off small base)
- ADR: +167%
- Paid occupancy: +1,343% YoY
Greater Philadelphia
- Reservations per property: +743% YoY
- Revenue per property: +466% YoY
- Paid occupancy: +644% YoY
Greater Atlanta
- Reservations per property: +513% YoY
- Revenue per property: +236% YoY
West Coast Underperformance
A clear geographic pattern emerges with West Coast markets significantly underperforming:
Greater Los Angeles: -10% reservations per property, -12% revenue per property, with roughly flat ADR and slightly negative paid occupancy.
Vancouver Area: -11% reservations per property (though revenue is up +164% on rate gains), ADR down -22%, but paid occupancy up +264%.
San Francisco Bay Area: Essentially flat reservations per property (0%), but revenue up +109% driven by +134% ADR increase, with slightly negative paid occupancy.
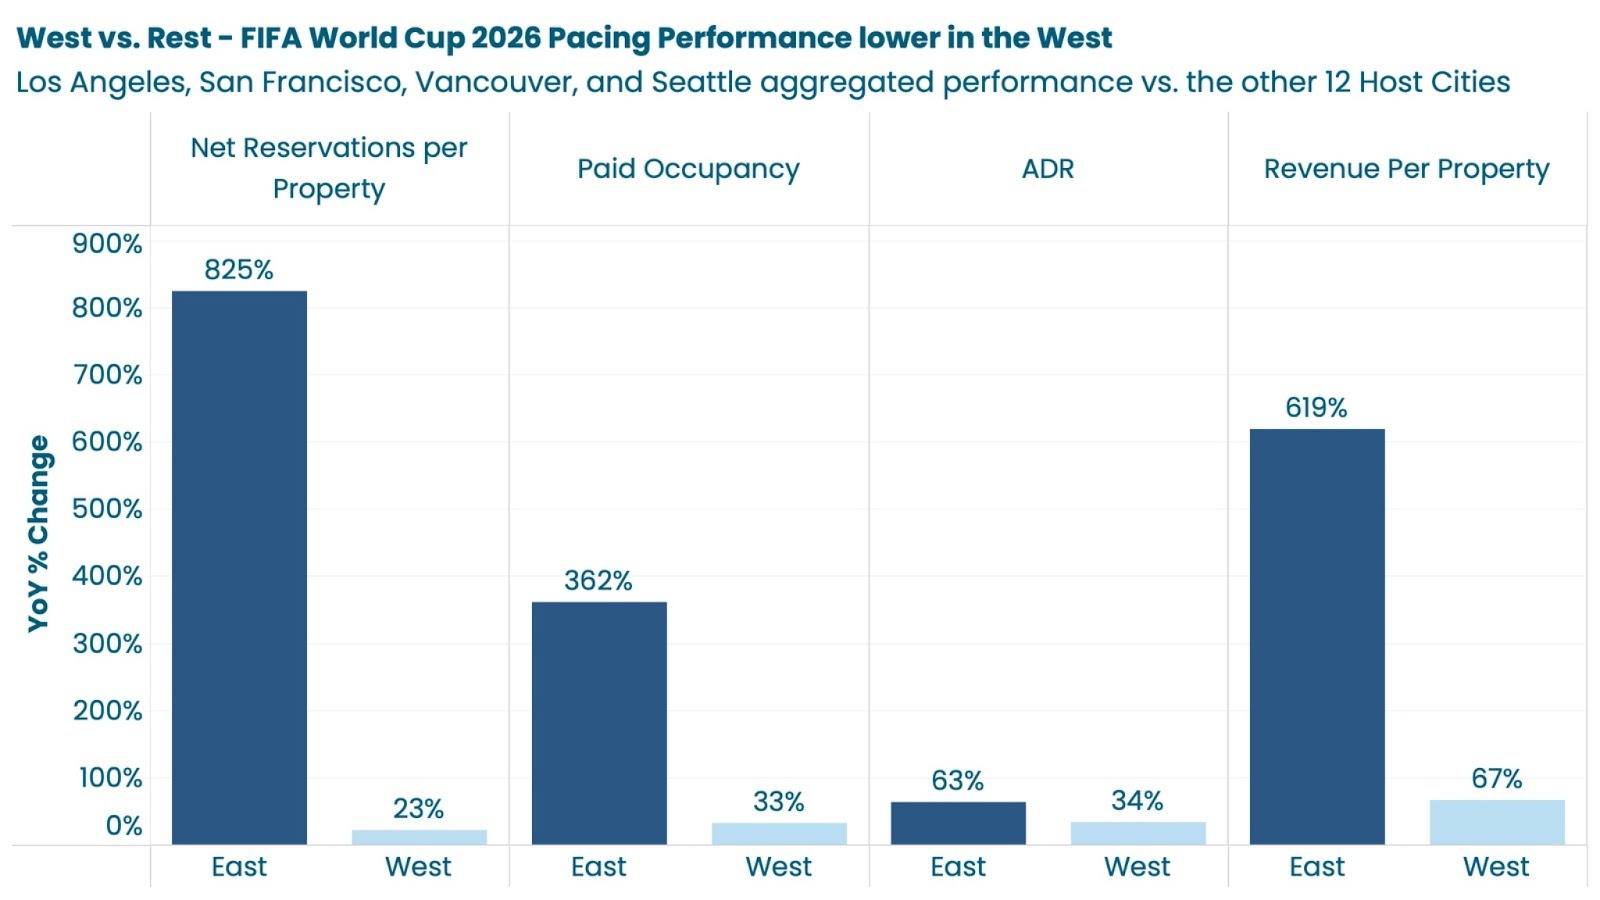
Why West Coast Markets Underperform: Schedule, Geography, and Regulation
Analysis of the FIFA World Cup 2026 match schedule reveals stark disparities that explain West Coast booking weakness. West Coast cities (Los Angeles, San Francisco, Seattle, Vancouver) host zero semifinals, zero finals, and only one quarterfinal (LA), while East Coast and Central markets dominate knockout stages: Atlanta and Dallas each host semifinals, New York/New Jersey hosts the final, and Boston, Miami, and Kansas City secure quarterfinals. Group stage assignments compound this gap; Eastern cities welcome traditional powerhouses (Boston hosts England and France, Philadelphia gets Brazil and France, Dallas features Argentina and England), while West Coast cities receive weaker lineups.
Geography amplifies the schedule disadvantage: most World Cup fans travel from Europe and Latin America, where East Coast cities offer shorter flights and more direct routes. West Coast travel requires significantly longer journeys from these key markets. Additionally, stricter short-term rental regulations in San Francisco, Vancouver, and Seattle may constrain inventory expansion—though the absence of corresponding ADR spikes suggests vacation rentals may simply hold lower market share for major sporting events in these cities compared to hotels. Combined, these factors explain why East Coast markets show 500-3,300% reservation increases while West Coast cities post flat-to-negative volume growth.
Full Event Period: Who Wins Over 39 Days?
Looking at the complete June 11 - July 19 window reveals which markets sustain performance across the entire tournament:
Top 5 Markets (by reservations per property)
- Guadalajara: +3,329% reservations, +615% revenue
- Greater Boston: +1,954% reservations, +814% revenue
- Kansas City: +1,504% reservations, +3,381% revenue
- Greater Philadelphia: +749% reservations, +427% revenue
- Greater Atlanta: +469% reservations, +237% revenue
Rate vs. Volume Strategies
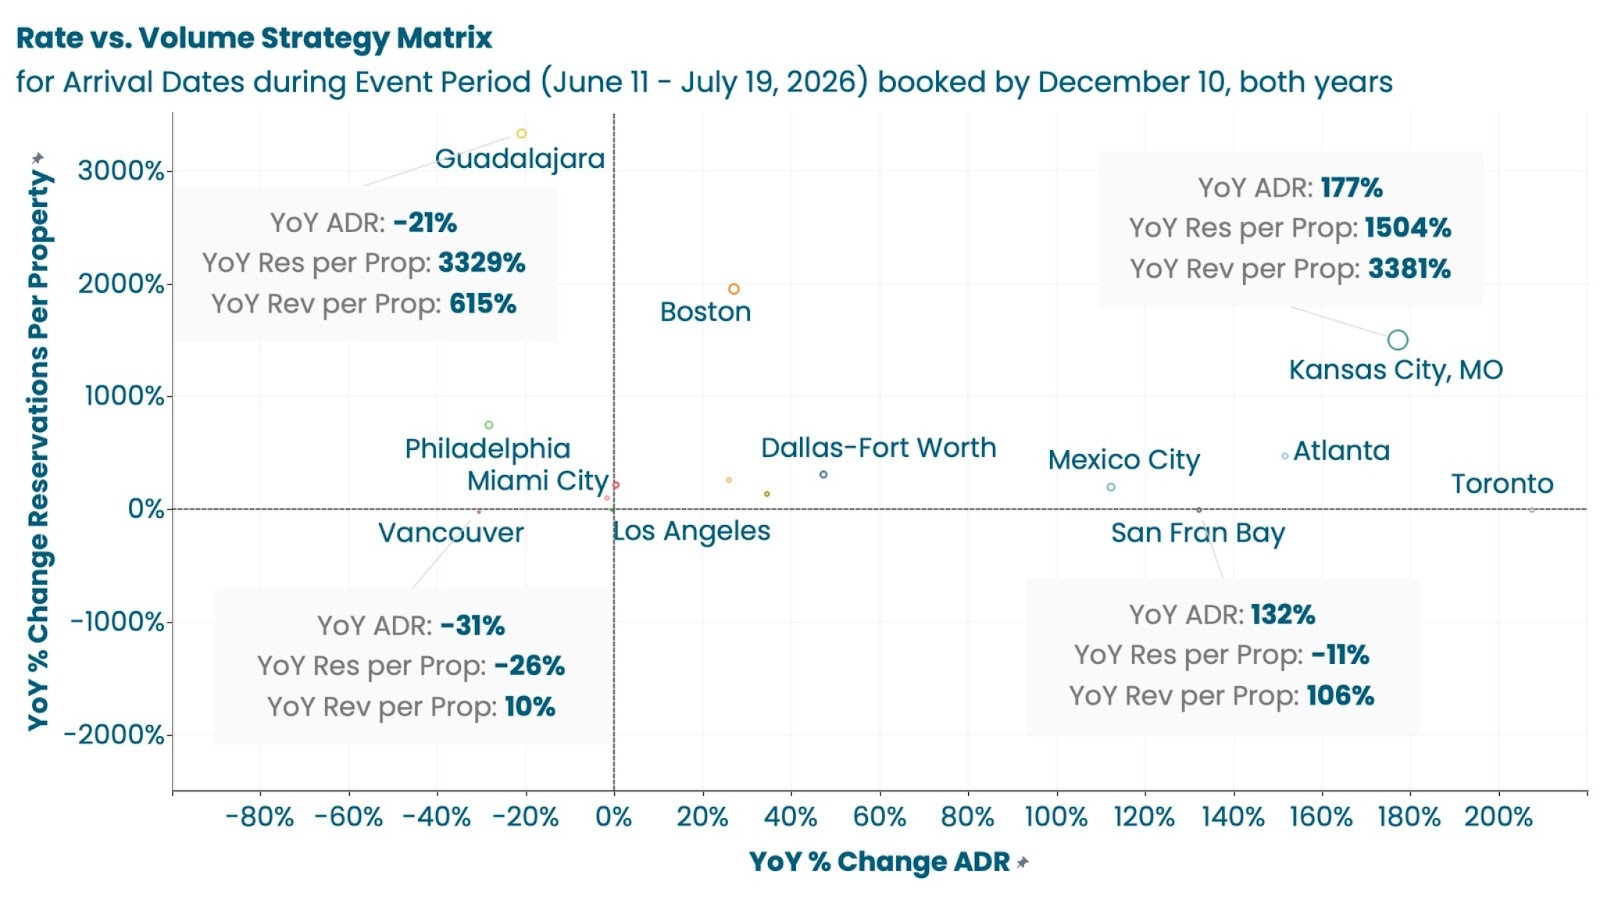
Understanding Market Strategies: The Volume vs. Rate Trade-off
The strategy matrix reveals four distinct approaches markets are taking to capitalize on World Cup demand, plotted by reservations per property growth (volume) against ADR growth (rate). Top-right "balanced winners" like Boston, Kansas City, and Atlanta achieve the ideal position; capturing both massive reservation increases and substantial rate premiums, demonstrating they can fill properties while commanding premium pricing.
Bottom-right "volume-led" markets like Guadalajara and Philadelphia prioritize occupancy over pricing, driving enormous reservation growth (+749% to +3,329%) but accepting ADR declines (-21% to -28%), a questionable strategy that leaves significant revenue on the table despite strong demand signals.
Top-left "rate-led" markets like San Francisco and Toronto take the opposite approach, posting ADR increases of +132% to +207% while accepting flat or negative reservation growth, suggesting constrained supply or selective inventory strategies that capture premium positioning but sacrifice volume.
The Bottom-Left Challenged Markets
Three markets show concerning weakness on the volume side:
- Vancouver Area: -26% reservations per property, +10% revenue per property
- San Francisco Bay Area: -11% reservations per property, +106% revenue per property
- Toronto: -11% reservations per property, +121% revenue per property
Notably, even these "underperformers" generate revenue growth (except Vancouver's minimal +10%), indicating that rate premiums can offset volume declines—but these markets are clearly leaving money on the table compared to the demand leaders.
Booking Window Analysis: Urban Markets See Unprecedented Advance Demand
One of the most striking behavioral shifts revealed in the data is how far in advance travelers are booking World Cup accommodations, particularly remarkable given that these are primarily urban markets where typical booking windows are notably short.
The Urban Market Context
Unlike leisure destinations where guests often book 60-90+ days in advance, urban vacation rental markets typically see much shorter booking windows—often 14-30 days for business travelers and 30-45 days for leisure guests. Cities like Boston, Philadelphia, Atlanta, and Dallas normally attract last-minute bookers, spontaneous weekend visitors, and business travelers with compressed planning cycles.
This makes the World Cup booking window data especially significant: we're seeing urban market behavior transform to resemble resort or event-driven destination patterns.
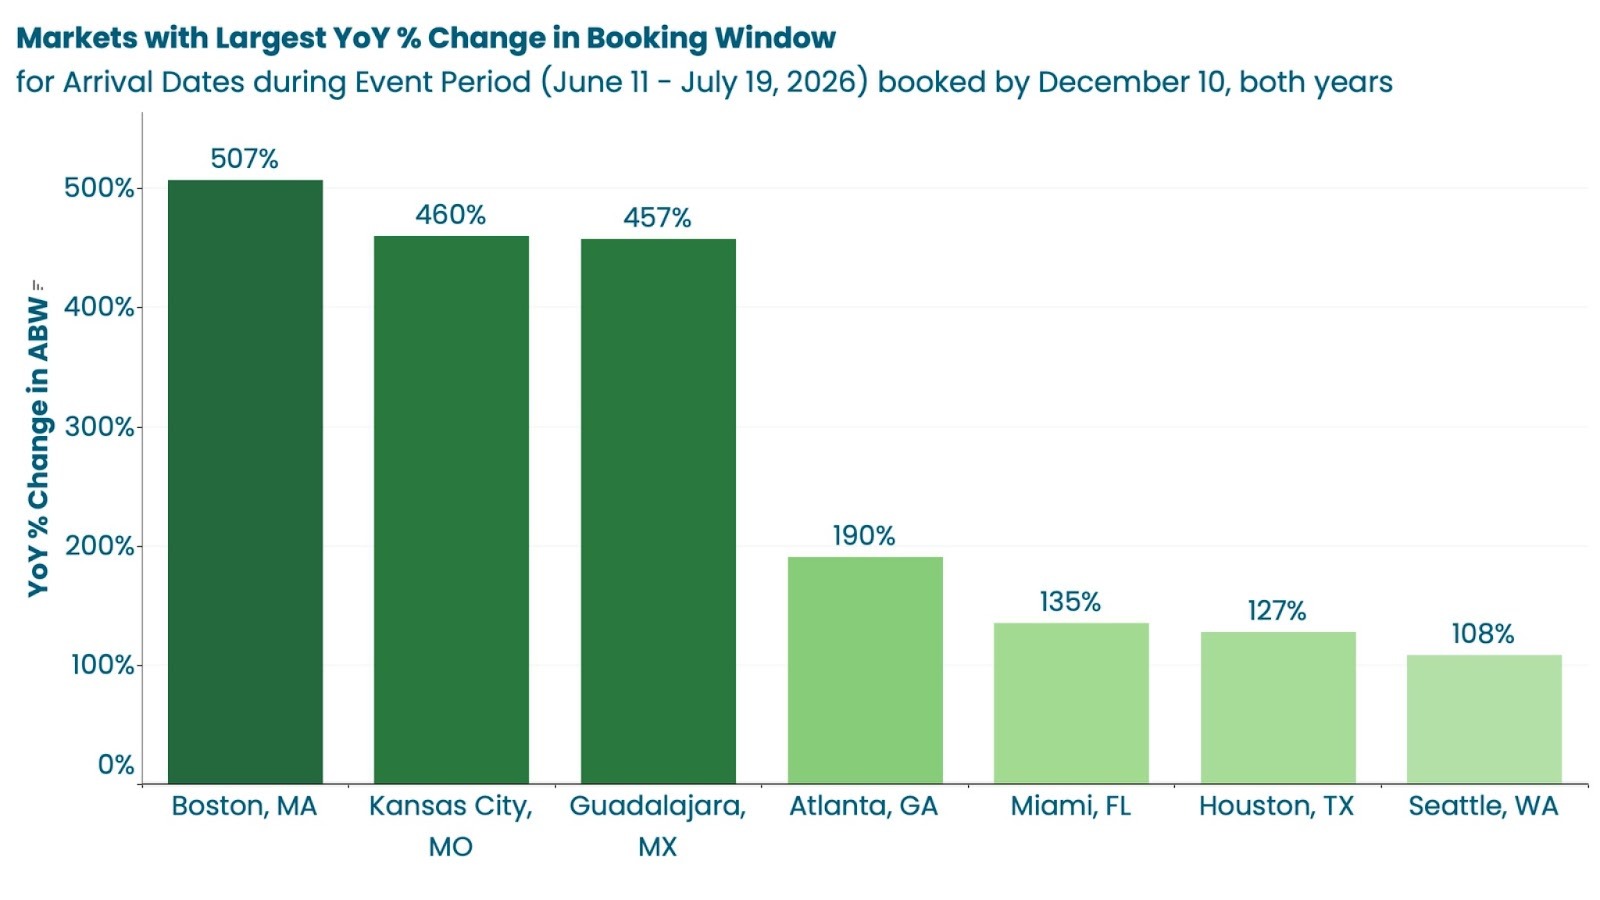
Schedule Release Week (Dec 1-7, 2025): Dramatic Lead Time Extension
During the schedule announcement week, average booking windows (ABW - the time between booking and arrival date) showed dramatic increases that fundamentally contradict typical urban market behavior:
Top Markets for Extended Booking Windows:
Greater Boston: Average booking window of 121.63 days (December 8 data point) for stays 6+ months out which is extraordinary for an urban market that typically sees 25-35 day booking windows. Earlier in the week, Boston showed +258% YoY increase in available booking window.
Guadalajara: ABW increased +425% YoY, indicating travelers are securing stays 4-5 times further in advance than the previous year for this urban market.
Greater Atlanta: Booking window extended to 43.76 days for the December 1-7 period, roughly double the typical urban booking window.
Kansas City: ABW up +137% YoY, transforming from a typically last-minute urban market to one with extended advance planning.
Greater Philadelphia: ABW increased +62% YoY during schedule release week, pushing urban booking patterns toward leisure destination timelines.
Why This Matters: Demand Is Real and Early
The extension of booking windows in urban markets is one of the clearest signals that World Cup demand is materializing early and with high conviction. In normal circumstances, urban markets don't command long booking windows because:
- Supply abundance: Cities have more accommodation options (hotels, vacation rentals, extended stays)
- Business travel patterns: Corporate travelers book close to travel dates
- Lower urgency: Urban visits are less "once-in-a-lifetime" than resort destinations
- Flexible substitutes: Travelers can often find last-minute options
The fact that World Cup travelers are booking urban markets 6+ months in advance demonstrates:
- Scarcity perception: Travelers believe inventory will be constrained
- High commitment: These aren't tentative bookings, guests are locking in plans
- Premium willingness: Early bookers typically accept higher rates and stricter terms
- Authenticity of demand: This isn't speculative booking, it's genuine fan travel
Event Period Booking Windows: Urban Markets Acting Like Resorts
For actual event-week stays (June 11 - July 19, 2026), booking window data reveals urban markets performing like traditional leisure destinations:
Longest Average Booking Windows (Event Period):
- Greater Boston: 66-122 days advance booking across different event weeks (compare to typical 25-35 days)
- Greater Atlanta: 43-66 days advance booking (compare to typical 20-30 days)
- Greater Philadelphia: 25-43 days advance booking (still elevated for urban market)
- Dallas-Fort Worth: 21-31 days advance booking (near typical urban range)
Shorter But Still Extended Windows:
- Greater Houston: 27-36 days (slightly above typical 20-28 days)
- Greater Los Angeles: 41-52 days (elevated for major metro)
- Greater Seattle: 33-49 days (elevated for West Coast urban)
The High-Demand Markets Book Earliest
A clear correlation emerges: markets with the highest demand also show the longest booking windows. Boston, Philadelphia, and Atlanta, the volume leaders, have travelers booking 2-4 months in advance, transforming urban booking behavior to match resort destination patterns.
This correlation is critical because it proves:
- Demand quality: Long booking windows + high demand = real, committed demand
- Market confidence: Travelers trust these markets will deliver World Cup experiences
- Supply constraints: Early booking reflects genuine scarcity concerns, not just enthusiasm
- Revenue security: Properties in these markets are locking in revenue quarters in advance
Markets with Shorter Windows Still Show the Urban-to-Resort Shift
Even markets showing "shorter" booking windows by World Cup standards are still operating well above typical urban market norms. Los Angeles at 41-52 days and Seattle at 33-49 days would normally see 20-35 day windows for leisure travel.
The fact that even underperforming markets show extended booking windows validates that World Cup demand is fundamentally different from normal urban travel patterns. These cities are temporarily behaving like destination resorts, presenting a rare opportunity for property managers and destination marketers to create a massive positive impact on their bottom line.
Key Takeaways for Vacation Rental Operators
1. Rate Optimization is Critical: With such dramatic demand increases, sophisticated dynamic pricing will be essential. Markets showing +100-200% ADR increases demonstrate substantial willingness to pay.
2. Geographic Disparities are Stark: Central and Eastern markets (Kansas City, Boston, Philadelphia, Atlanta) vastly outperform West Coast markets. This likely reflects match schedules, team assignments, and fan travel patterns.
3. The Schedule Matters: The immediate December booking surge confirms that fans book quickly once match details are known. Operators who weren't ready missed the initial wave.
4. Capture Early Bookers with Confidence: Extended booking windows (transforming 20-30 day urban markets into 60-120+ day destination patterns) mean travelers are committing far in advance. This is unprecedented for urban markets and validates aggressive strategies: operators could confidently implement longer minimum stays, stricter cancellation policies, and premium pricing. The data shows guests will accept them because they perceive real scarcity.
5. Supply Matters: Markets like Guadalajara and Kansas City show that even enormous percentage gains may reflect small prior-year bases. Absolute inventory levels will determine total revenue capture.
6. Minimum Stays Are Justified: With paid occupancy increases of +300-1,300% in top markets, implementing minimum night requirements around key matches is clearly supported by demand.
7. Urban Market Transformation: The shift from typical 20-35 day urban booking windows to 60-120+ day World Cup windows is the clearest proof that demand is materializing early and authentically. This isn't speculative booking—it's committed travel plans by guests who understand scarcity and are willing to lock in accommodations quarters in advance. Operators should price and manage inventory accordingly, recognizing this is temporary resort-market behavior in urban contexts.
What's Next?
With the event still six months away, several factors will influence final outcomes:
- Team qualification results will drive fan travel patterns
- Match scheduling (group stage, knockout rounds) will create demand peaks
- Booking velocity beyond the initial surge will determine final demand
- Cancellation patterns as the event approaches will affect net absorption
For vacation rental operators in host cities, the data is clear: this is a once-in-a-generation demand event. Markets that execute well on pricing, inventory management, and guest experience will see returns that dwarf typical annual performance.
Analysis based on vacation rental booking and arrival data across 16 FIFA World Cup 2026 host cities, comparing 2025 bookings and 2026 event-period pacing to 2024 baseline data.