


Key Takeaways:
- Using short-term rental data analysis can help you benchmark occupancy, ADR, and RevPAR against a clean comp set, so pricing decisions are based on market context.
- Treat pace, booking window, and lead-time shifts as early warning signals to adjust distribution, operations, or strategy before revenue and occupancy changes.
- Turn operational data into action by forecasting turnover load, quantifying lost nights from delays, and using clear market-context reporting to build trust and retention.
Property management companies are competing in a tighter, faster market—where the teams that spot shifts early (and make informed decisions) can protect revenue and capture market demand.
Misinformed or late decisions can cost you missed rate opportunities, operational efficiency, avoidable vacancies, and homeowner churn. Short-term rental data analysis can surface the most recent market insights, enabling you to make better, informed decisions.
Most teams already have plenty of dashboards, PMS exports, and channel reports. However, the hard part is turning that noise into a clear call on what (and when) to change, across revenue and operations.
The U.S. travel industry generated $2.9 trillion in economic output, with $1.3 trillion in travel spending in 2024. Even a minor optimization mistake can compound when demand is this high.
In this article, we’ll review how to move from reactive management to proactive strategy by using STR data analysis to answer the most practical questions:
- Where you stand in comparison to the market.
- What’s changing (and why).
- What you should do next.
From Data Collection to Decision-Making
Why Data Without Decision Frameworks Falls Short
Most property managers don’t struggle because they lack numbers. They struggle because the numbers don’t help identify the next move.
When data doesn’t give you the information you need at the moment, the dashboard gets ignored.
Data becomes useful when it’s tied to a decision:
- What are we changing this week?
- What are we holding steady?
- What are we testing and measuring?
A U.S. Census Bureau study found that 18% of establishments used >75% of structured management practices, while 27% used <50%, and stronger practices were associated with better performance.
Teams with clearer routines for monitoring and targets can turn tourism data into action more consistently.
What Data Analysis Actually Means in Property Management
It’s not simply about reviewing your own portfolio KPIs. It’s about understanding what those KPIs mean in context, so you can act without guessing.
Your STR data analysis should involve:
- Comparing performance to the market and a relevant comp set.
- Spotting patterns that show risk (softening pace, shorter lead times, weakening rate acceptance).
- Finding patterns that show opportunity (demand pockets, segment outperformance, seasonality shifts).
- Pressure-testing assumptions (e.g., “Is occupancy down because of pricing, distribution, or property quality?”)
Guided insights can help you shorten the time from data and portfolio review to action. Dex AI is designed to turn your portfolio review process into a focused weekly plan, enabling you to make faster, more informed decisions.
The Three Core Questions Data Analysis Answers
Performance Benchmarking: Where Do You Stand?
Understanding your position requires comparing your portfolio performance against multiple reference points:
Market-Level Comparison
- How do your occupancy and ADR compare to the overall market?
- Are you outperforming or underperforming, and by how much?
Competitive Set Analysis
- How do similar properties (same bedroom count, location, amenities) perform?
- Where are you winning and losing bookings?
Year-Over-Year Trends
- Is this year's performance better or worse than last year?
- Are you gaining or losing market share?
- Seasonal pattern comparison: Is this year's shoulder season softer than last year's?
Trend Identification: What's Changing and Why?
Beyond static comparisons, property managers need to identify emerging patterns that signal when to act:
Booking Pace Shifts
- Are reservations coming in faster or slower than typical for this time period?
- How does your pace compare to the market pace?
- Are there competitive positioning issues?
Booking Window Changes
- Are travelers booking further in advance or more last-minute?
- What does this mean for pricing strategy and marketing spend timing?
Demand Concentration Patterns
- Which property types, locations, or bedroom counts are seeing demand growth vs. decline?
- Are certain submarkets outperforming while others soften?
Strategic Decision Support: What Do You Do Next?
Data only matters if it drives action. Property managers need to translate insights into decisions:
Pricing and Revenue Management Adjustments
- Should you lower rates to capture bookings or hold firm?
- Which specific dates or property types need pricing intervention?
Marketing and Distribution Changes
- Should you increase ad spend on certain channels or property types?
- Do you need to enhance listings for underperforming properties?
- Which booking channels are delivering vs. underdelivering?
Inventory and Portfolio Decisions
- Should you add properties in a hot submarket?
- Are certain property types underperforming consistently enough to exit?
- What amenities or features correlate with higher performance?
Homeowner Communication and Retention
- How do you explain performance to homeowners using market context?
- Can you demonstrate that external market factors (not your management) drove results?
Revenue Optimization: Strategic Decision Frameworks
Pricing Strategy Decisions
When you’re deciding whether to price more aggressively or protect rate integrity, focus on how your portfolio performs relative to your market segment, not competitors’ rates.
Begin With Benchmarking
Compare your occupancy, ADR, and RevPAR against a clean comp set (same bedroom count, amenities, submarket). Look at where you’re winning (high occupancy/low ADR or high ADR/low occupancy) to identify your strengths.
Validate Strategy With Occupancy Response
If you’re consistently running higher occupancy than the market while sitting at lower ADR, you may be missing out on rate opportunities.
If you’re soft on occupancy even at a competitive ADR, the constraint may be distribution, listing quality, or property readiness, rather than price.
Seasonality Shifts
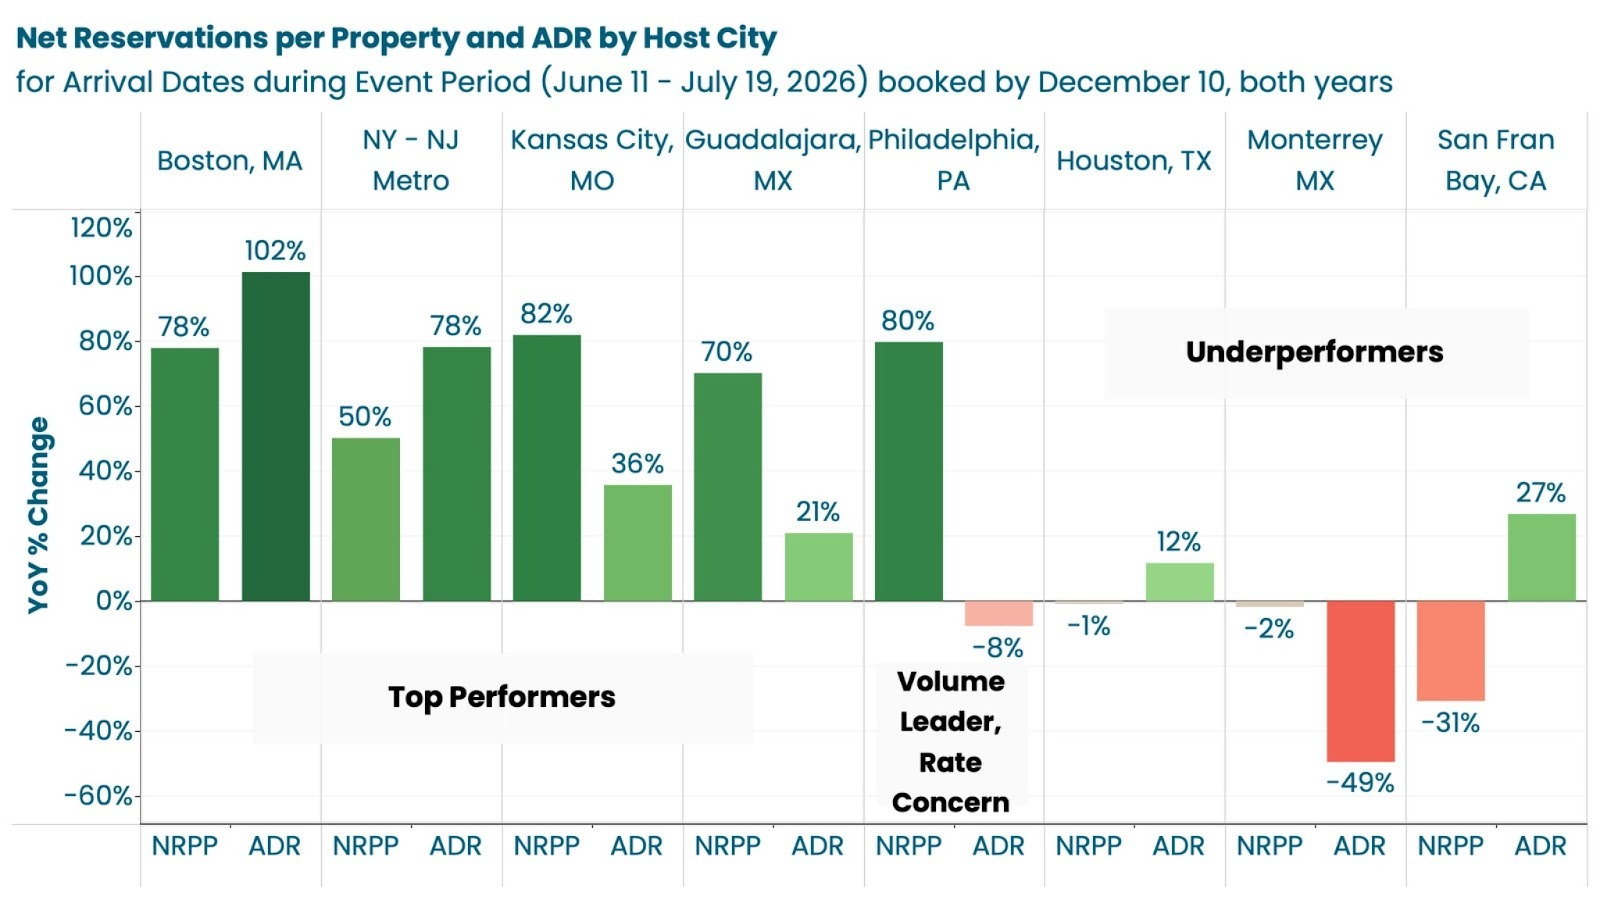
Shoulder seasons often behave differently from the peak weeks. Meanwhile, Event-driven spikes can flip your normal playbook overnight. For instance, during the FIFA World Cup 2026 schedule release, host markets averaged over 29% growth in reservations per property and ADR of over 25%.
Stay Decision-Focused
Use benchmarks to set guardrails (e.g., “no discounts before pace softens,” or “protect weekends”) and to test hypotheses.
Avoid purely market-following logic. Your pricing decisions should be grounded in your own performance + the independent market context, not coordination.
Portfolio Composition Decisions
Growth decisions can become costly if you expand into the wrong unit type, submarket, or amenity tier. Data analysis can help you prioritize expansion where you have both operational fit and market opportunity.
Break Down Performance Segments
Segment by bedroom count, property type, submarket, and key amenities. Identify which categories produce:
- Stronger revenue consistency.
- Easier operational execution (turnover, maintenance cadence).
- More resilient shoulder-season demand.
Read Saturation and Demand Signals
If supply is growing faster than demand in a segment, you’ll observe it in pacing before noticing it in annual averages. Using advanced analytical tools for performance comparison and market benchmarking can help you understand demand and saturation signals before adding supply.
Use Projections Sensibly
Use rental projections to check onboarding targets: start with an address, pull performance from comparable homes in a tight radius, then adjust for property conditions/amenities and expected owner-stay nights so the rentable year is realistic.
Where a prior year's performance is distorted by a one-half shock, such as storms or fires, reference a different baseline year, so you’re not underwriting growth on an anomaly.
Booking Window and Lead Time Strategy
Your timing strategy can help you decide when to optimize for advance bookings and when to hold inventory for higher-value demand.
Understand Booking Window Patterns
Urban and event markets can behave very differently from leisure destinations.
Use Real Lead-Time Signals
In major-event conditions, lead times can stretch dramatically, even in normally short-window cities.
For instance, during the FIFA World Cup 2026 schedule release, Greater Boston showed an average booking window of 121.63 days (an unusually long lead time for an urban market), while Kansas City saw over 137% YoY growth in available booking window.
Adjust Without Guessing
When your forward pace shows strong early demand with rate strength, you can prioritize securing base demand while protecting peak-night pricing.
When late demand is the pattern (and rates don’t collapse), you can avoid over-discounting early and keep optionality for premium bookings.
And if you’re missing the market’s advance demand, treat it as a visibility/distribution problem first—then reassess pricing once you’ve fixed the exposure.
Operational Efficiency: Strategic Decision Frameworks
Staffing and Resource Allocation Decisions
When you use booking pace, turnover patterns, and property concentration data together, you can turn staffing into proactive capacity planning.
Forecast Busy Weeks
Use forward-looking booking pace and day-of-week patterns to see when check-ins/outs will spike, and staff accordingly based on the turnover load, rather than the previous week’s averages.
Find Lost Nights
Track where late checkouts, slow maintenance, or delayed cleans block same-day turns, and force calendar holds. Convert that into monetary value by tying blocked nights to your average unit revenue.
Run Pressure Test
Major events can compress operations into a few high-intensity days. For instance, during the 2025 Sundance Film Fest, adjusted paid occupancy rose 18% week-over-week to 59%, ADR increased 17% to $810, and RevPAR increased 72%.
Such surges can be highly rewarding if you plan for spikes, staffing, and vendor coverage early.
Plan for Labor Churn
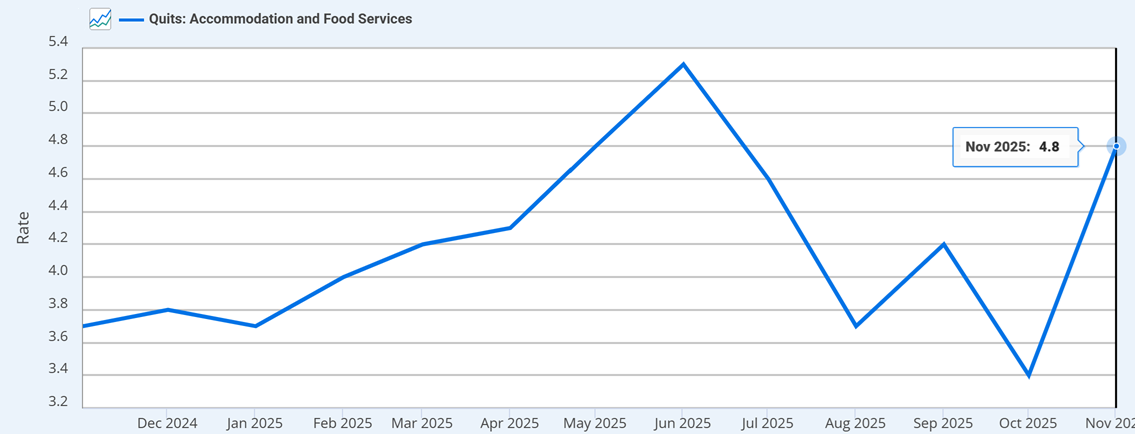
Accommodation and food services had a 4.8% quit rate in November 2025, highlighting the need for staffing plans with buffers, cross-training, and earlier scheduling based on pace signals.
Market Expansion and New Market Entry
Before you commit headcount and operational overhead to a new market, use performance and pacing benchmarks to validate demand strength, seasonality risk, and competitive saturation.
Validate Market Fit
Benchmark occupancy, ADR, and RevPAR in the target market, then break it down by submarket and property type so you’re not averaging away risk.
Watch for Saturation Signals
If supply grows faster than demand, you’ll often see it first in pacing softening and booking-window shifts before it shows up in annual performance summaries.
Set Realistic Targets
Use rental projections, grounded in real, local comps, to help your team estimate revenue ranges by month, then adjust expectations for condition, amenity set, and owner-stay nights (to ensure you don’t report a best-case scenario that can’t be operationally delivered).
Homeowner Communication and Retention
Data-backed reporting helps you turn performance conversations into trust-building conversations by showing what’s market-wide, what’s unit-specific, and what you’re doing about it.
Lead With Context
Show each unit’s performance against its market and comp set, so homeowners can see whether changes are market-driven or property-specific.
Prove Proactive Management
Pair leading indicators (pace, booking window, ADR trends) with operational actions you’re taking (turnover coverage, maintenance readiness, marketing/distribution fixes) to demonstrate control.
Ensure Transparent Reporting
Use clear, visual reporting that you can explain to homeowners in minutes. The goal should be to build confidence and retain homeowners by providing information and reports they can understand.
Technology and Tool Investment
The best tech investments are those that remove friction in day-to-day operations and improve decision-making speed by using reliable data to guide what you should prioritize.
Eliminate Bottlenecks
Prioritize tech that can help you reduce unbookable gaps (turnover scheduling, maintenance workflows, faster approvals) and improve decision speed across your teams.
Strategize and Execute
Pricing tools can help you execute rate changes, but you’ll still need performance intelligence to validate outcomes, spot risk early, and communicate clearly with your teams.
Adopt AI Assistance
Key Data’s Dex AI is designed to surface “what’s working, what needs attention, and what comes next,” allowing you to prioritize the right properties and issues more quickly, especially when the pace shifts mid-week.
The Competitive Advantage of Better Decisions
Treating short-term rental analysis as a decision framework can help you tighten your revenue strategy and remove operational friction, so you can move faster than your competitors based on market data.
Combining your internal performance with independent market context can help you protect and grow revenue, run efficient operations, and retain homeowners.
Strategic decisions require strategic intelligence. Request a demo today to see how Key Data can help you benchmark performance, identify opportunities, and make confident decisions that can drive revenue growth and operational efficiency.