


Key Takeaways
- RevPAR is a core performance metric for short-term rental operators, requiring added context such as stay length, unit type, and pricing flexibility.
- Hotels rely on RevPAR for forecasting, pricing, and benchmarking. They track revenue per available room to evaluate portfolio health and market competitiveness.
- Longer stays, higher ADRs, and seasonal pricing make RevPAR more volatile; therefore, pairing it with supporting KPIs, like stay lengths, and pacing, yields clearer insights.
- Hotels benefit from standardized staffing and occupancy-driven revenue, while short-term rentals gain agility and higher per-booking returns through flexibility and niche targeting.
- Key Data provides unified, first-party performance intelligence to benchmark, forecast, and grow strategically.
One Metric, Two Models
For a long time, RevPAR has been the gold standard metric in the hotel and hospitality sector, and in recent years, it has become just as relevant for short-term rental performance. In the U.S., hotel RevPAR climbed, driven by modest gains in ADR and occupancy.
In this article, we’ll examine how RevPAR translates across hotels and short-term rentals, influences decision-making and revenue strategy, what it means for professional operators, and how Key Data can help you analyze both models.
What Is RevPAR and Why Hotels Rely on It
RevPAR) Revenue Per Available Room) measures how much revenue a hotel generates per available room, regardless of whether every room is sold. It can be calculated with either one of these two simple formulas:
- RevPAR = ADR x Occupancy rate
- RevPAR = Total room revenue / Total nights available
For instance, a hotel charging an ADR of $150 with 70% occupancy would achieve a RevPAR of $105 ($150 x 0.70).
Why Hotels Depend on RevPAR
Hotels use RevPAR to track revenue on a per-room basis, making it easier to compare across properties or markets of different sizes. Because it blends both price (ADR) and demand (occupancy), RevPAR offers a more balanced view than either metric on its own.
In hotel revenue management, RevPAR plays several critical roles:
- Forecasting and Budgeting: Project future performance by modelling ADR and occupancy shifts to estimate RevPAR trends.
- Benchmarking: Compare RevPAR performance against competitors or comp sets to identify market share gains or losses.
- Strategic Pricing Decisions: Changes in RevPAR help evaluate whether pricing adjustments (higher rates, volume strategies, discounts) are effective.
- Portfolio and Brand Comparisons: RevPAR normalizes revenue by room availability, so it’s widely used in brand- and portfolio-level performance comparisons.
How RevPAR Applies to Short-Term Rentals
You can also use RevPAR as a short-term rental manager; however, it comes with added nuance. Unlike hotels, short-term rentals often deal with variable stay lengths, multi-bedroom units, diverse guest types, and price flexibility across channels or seasons. This level of complexity means RevPAR must be interpreted alongside other performance metrics.
Nuances That Can Make a Difference
- Supply Shifts: Active inventory fluctuates as properties enter and exit the short-term rental market, affecting comparative performance metrics and market benchmarks over time.
- Multi-Bedroom Properties: A 4-bedroom unit has a different revenue potential than a studio. Aggregating across varying unit types requires normalization.
- Different Guest Profiles: Families, remote workers, groups—each segment behaves differently in booking pace, length of stay, and price sensitivity.
- Flexible Pricing by Channel/Seasons: Short-term rentals may run promotions, length-of-stay discounts, or OTA-specific pricing.
Due to these variables, RevPAR in the short-term rental landscape is more volatile and must be paired with supportive KPIs to deliver valuable insights.
Supporting KPIs
To get complete clarity, you must typically analyze:
- Average Daily Rate (ADR): The average rate per charged night. It acts as the price component of RevPAR.
- Length of Stay (LOS): The number of nights guests typically stay; a rising LOS helps smooth occupancy fluctuations. Studies show that stay lengths in the U.S. increased from 3.7 to 4.1 nights following the COVID-19 pandemic.
- Booking Window and Pacing: How far in advance guests book, and how bookings accumulate over time. Shorter lead times compress your ability to react.
- Channel Distribution: The mix of OTA, direct, or private channels shapes commission, costs, rate control, and ultimately net revenue.
- Unit Type/Bedroom-Count Filters: Comparing similar property types ensures more accurate benchmarking. For instance, measuring a 2-BR condo against a 4-BR beach house would distort your RevPAR comparison. Filtering units by size and amenities ensures you’re evaluating performance on a like-for-like basis.
For example, in June 2025, U.S. short-term rental occupancy dipped slightly to 63.2%, down from 64% in 2024, even as ADR held firm, illustrating that subtle occupancy shifts can drive RevPAR shifts.
Performance Comparison — Hotel vs. Short-Term Rental
Here are some comparisons highlighting how performance drivers differ across hotels and short-term rentals.
Average Daily Rate
- Hotels usually price themselves high, have an increased nightly turnover, and maintain brand consistency.
- Professionally managed short-term rentals often command higher nightly rates in leisure markets due to their space, amenities, and ability to accommodate larger parties.
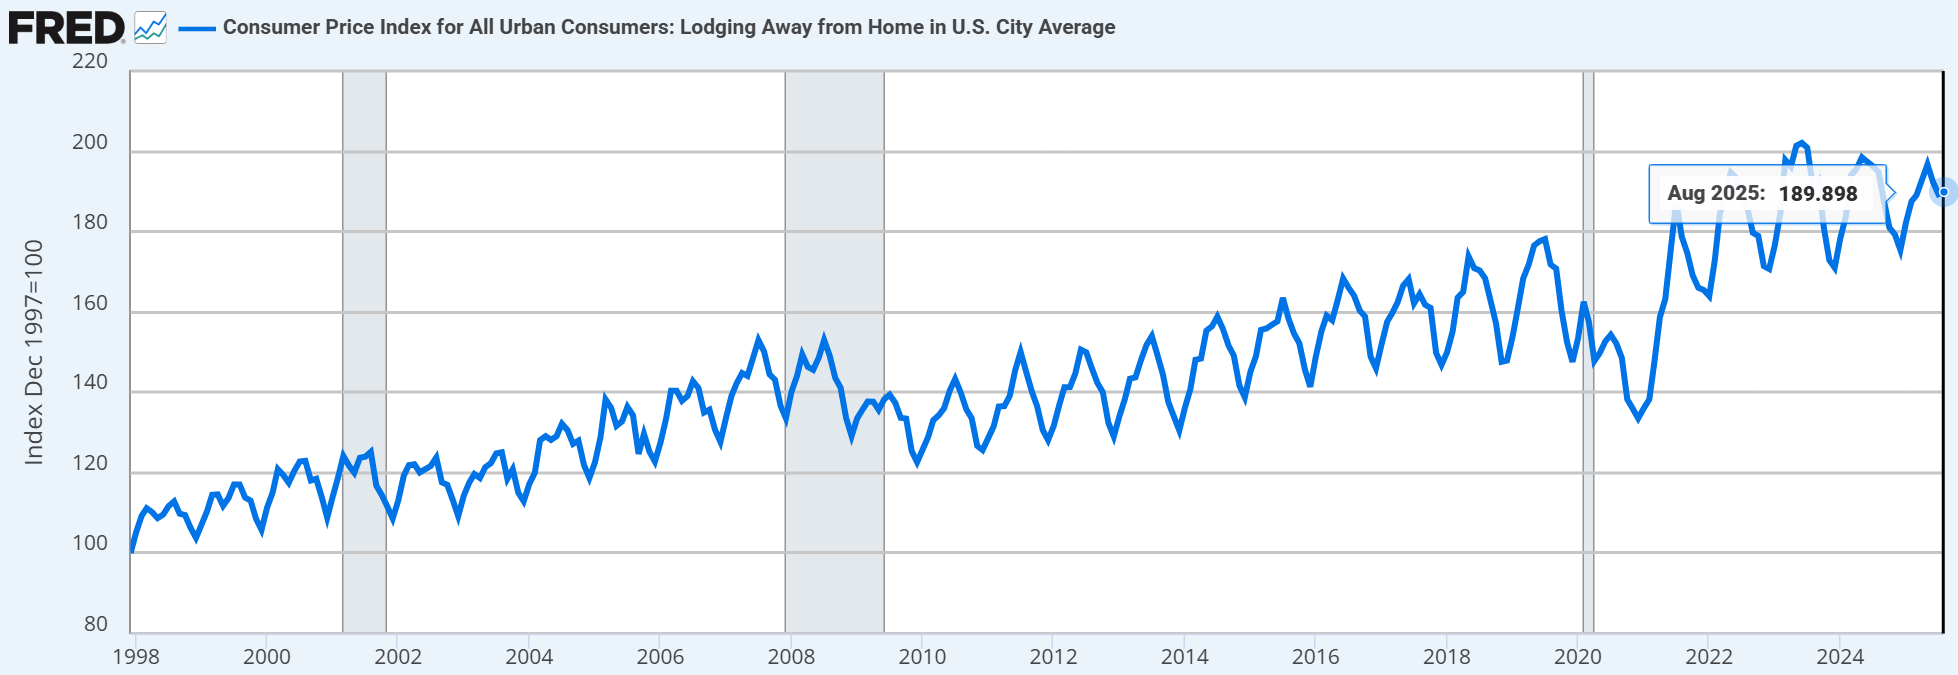
- According to the U.S. CPI for Lodging Away from Home, the index reached about 190 in August 2025 (December 1997 = 100), indicating that lodging prices are roughly 90% higher than in 1997, underscoring the sustained pricing power across the industry.
Occupancy
- Due to their broad distribution and standardization, hotels tend to maintain higher and more stable occupancy rates.
- Depending on season, unit type, and local regulations, short-term rental occupancy is more variable.
- The U.S. travel and tourism industry's output grew by 7% in 2023, with traveler accommodations among the largest contributors, supporting occupancy across the industry.
Revenue per Available Room/Rental
- Both sectors use RevPAR to track revenue yield per available night.
- According to the Bureau of Economic Analysis, traveler accommodations were a major driver for price increases, contributing to a 2.3% rise in travel and tourism prices in 2023 (following a 12.5% jump in 2022).
Length of Stay
- Hotels typically experience shorter LOS (business transient, events).
- Short-term rentals experience longer LOS—families, remote work, multi-bedroom inventory, and minimum stay regulations expand stay length, shifting revenue concentration into fewer, higher-value bookings.
Booking Window and Pacing
- Hotels often convert in 1-2 weeks in many markets.
- Short-term rentals more commonly show longer booking windows in leisure destinations as planners secure specific homes well in advance. They also add shorter-lead shoulder-season stays.
- U.S. travel spending is projected to climb steadily over the next few years, reaching about $1.49 trillion by 2029, indicating continued resilience in domestic leisure demand and gradual recovery in business and international segments.
Revenue per Booking
- Hotels optimize for frequency and experience many short stays.
- Short-term rentals often achieve higher revenue per booking due to longer LOS and larger parties, even at lower annual occupancy.
Turnover Cost per Stay
- Hotels benefit from centralized, repeatable housekeeping and ops.
- Short-term rentals face higher per-stay resets (including whole-home cleans, linens, and amenities), which make LOS a critical metric for margin.
Operational and Strategic Considerations
The operational models between hotels and short-term rentals differ significantly. As a short-term rental operator or investor, you must evaluate which model best aligns with your resources, appetite for variability, and long-term goals.
Hotels: Consistency, Scale, and Brand Power
- Centralized Staffing and Standardized Inventory
- Hotels benefit from a unified workforce and repeatable process.
- Staff training, task protocols, and economies of scale reduce per-room labour cost variability.
- The cost of hiring and training new staff is generally far higher than retaining existing employees.
- Revenue Ties to Occupancy and Brand Strength
- Hotel ADR and occupancy often depend on a brand's reputation, marketing efforts, and distribution partnerships.
- A slight increase in occupancy across many rooms can yield substantial revenue.
- However, rising costs can squeeze margins: operating expenses above Gross Operating Profit (GOP) rose 4.1% in the U.S. hotels in 2024, outpacing revenue growth of 2.3%.
- Margin Pressure and Cost Escalation
- Rising food and beverage labor costs are pushing up total hotel labor expenses.
- In 2024, labor expenses increased by about $9 per room compared to 2023.
- Labor commonly accounts for roughly 50% of hotel operating costs, making staffing efficiency a critical element.
STRs: Flexibility, Variability, and Revenue Levers
- Flexible Unit Types, Pricing, and Markets
- Different property types (studios, multi-bedroom units, villas) can be deployed, and the amenities listed can be tailored.
- This ability allows for capturing boutique niches that hotels may not serve well.
- Greater Earning Potential per Booking
- Since stays in short-term rentals are often longer, revenue per booking tends to be higher than that of hotels.
- The ability to command premium rates per stay (versus per night) gives you a strategic upside, though risk and variation are greater.
- Variations in Operations and Marketing Demands
- Short-term rentals must manage various variables, including guest communications, check-ins, customized amenities, multiple listing platforms, local regulations, and turnover logistics.
- Marketing must also be more granular, with a focus on listing optimization, channel segmentation, and dynamic promotions being crucial.
Ask Yourself: Which Model Suits You Best?
- Resource alignment: Do you have the infrastructure and capital to support hotel-level staffing, brand consistency, and operational systems?
- Risk tolerance: Hotels offer steadier margins under scale; short-term rentals demand agility and comfort with variability.
- Revenue Strategy: Are you targeting volume (hotels) or per-stay yield (short-term rentals)?
- Market Fit: In markets with strong leisure travel, short-term rentals may outperform; hotels may have steadier fundamentals in saturated or business districts.
Regardless of your chosen model, selecting an advanced and comprehensive analytics platform that can ingest and normalize performance data across your hotels and rentals is essential. It ensures you never abandon insight when you expand or mix property types.0
Clarity Through Data, Not Preference
Whether you’re operating a boutique hotel, overseeing a regional vacation rental portfolio, or just exploring a mixed-asset investment, performance clarity starts with reliable data. In a market where demand cycles shift rapidly, having a unified view across property types enables you to adapt more quickly and grow smarter.
First-party data is now becoming the new baseline for reliable decision-making. Key data integrates directly with hotel and short-term rental property management systems, pulling real, verified reservation data from more than 700,000 properties worldwide.
By eliminating scraped or estimated figures, you gain a single source of truth for analyzing, comparing, and forecasting performance across your entire portfolio.
Whether you manage hotels, short-term rentals, or both, Key Data gives you the metrics you need to track performance, forecast demand, and grow strategically.