


Key Takeaways:
- International RevPAR benchmarking only makes sense when you add context, such as cost structures, FX movements, demand mix, seasonality, and market maturity.
- Use like-for-like comparisons by matching peer destinations and equivalent demand weeks, and read RevPAR alongside occupancy, ADR, booking lead time, and length of stay.
- Build performance bands instead of single targets so stakeholders can see the best-case expected and downside ranges across different economies and currency conditions.
As a destination leader at a professional property management company, you’re competing globally for travellers, hospitality investment, and long-term reputation, so benchmarking beyond your borders is now essential.
A strong RevPAR in one market can signal underperformance in another once you factor in cost structures, traveller spending power, and currency dynamics. That is why international RevPAR benchmarking needs proper context, not just numbers.
In 2024, the U.S. travel economy generated $2.9 trillion in economic output and $1.3 trillion in travel spending, placing increased pressure on destinations and operators to demonstrate performance through credible comparisons.
Context changes quickly, even within the domestic borders. During the 2025 Sundance Film Fest in Park City, RevPAR jumped 72% week over week, underscoring how events can distort normal baselines and make simple comparisons misleading.
Standardized, market-wide intelligence tools from Key Data, like DestinationData and ProData, can give you visibility into market performance and demand patterns, enabling you to make independent planning, reporting, and investment decisions with clear context.
In this article, we’ll review what RevPAR measures, why it’s used for destination benchmarking, why international comparisons can get complicated, and how to contextualize RevPAR across economies and market types to obtain a more accurate performance narrative.
RevPAR Fundamentals: A Brief Overview
What RevPAR Measures
Revenue per Available Rental measures the rental revenue a market or portfolio generates per available rental night.
- Formula: RevPAR = Total rental revenue / Total available rental nights
- A common equivalent expression in lodging is RevPAR = ADR x Occupancy (useful when you’re breaking performance into price and fill)
RevPAR compresses occupancy and pricing into a single metric, so you can see whether performance changes are driven by demand, rates, or both. It also indicates how effectively your available inventory is being converted into revenue, across units, submarkets, and time periods.
RevPAR is reliable only if the definition of available nights is consistent, especially regarding owner use, holds, and out-of-service nights, making direct-source data and clear methodology crucial in benchmarking.
Why RevPAR is Valuable for Destination Benchmarking
RevPAR allows you to compare a 2,000-unit destination to a 20,000-unit destination without the analysis being skewed by sheer supply. It gives you and your teams the ability to evaluate market strength even when supply levels and unit counts vary.
When used consistently, it makes it easier to spot whether performance shifts are structural (market-wide) or isolated (portfolio-specific). And it comes in handy during stakeholder reporting, investment narratives, and measuring the impact of events, seasonality, or access changes, without relying on raw numbers.
The Challenges of International RevPAR Comparison
Economic Context and Purchasing Power
Same Numbers, Different Context
A $150 RevPAR can signal premium performance in one country and mid-pack in another, depending on local price levels and operating costs.
PPP (purchasing power parity) allows you to adjust for cross-country price differences by comparing what money can actually buy.
Impact of Cost of Living
Labor, utilities, insurance, and services can vary widely by country and region, so strong RevPAR thresholds do not carry over cleanly across borders.
RevPAR per market, when paired with local context, becomes more meaningful than a universal score.
Currency Fluctuations
Even if local performance is flat, exchange-rate movement can make RevPAR look stronger or weaker when converted to USD.
For instance, the Federal Reserve’s Nominal Board Dollar Index shifted from 129.0413 in January 2025 to 120.5723 in December 2025, underscoring how currency movements can materially distort international comparisons.
Using Key Data to review performance with a consistent benchmarking view can help your team separate operational changes from FX-driven changes.
Market Maturity and Development Stage
- Emerging vs. Established Markets
- Emerging destinations can experience volatile RevPAR swings due to rapid supply growth, new airlift, and inconsistent seasonality.
- Mature destinations often show steadier baselines, but competition and regulation can cap growth.
- Infrastructure vs. Ecosystem
- Accessibility (direct flights, roads, public transportation), hotel density, event infrastructure, and service quality all shape how far ADR can stretch and how reliably occupancy holds.
- Regulation and Market Access
- Short-term rental rules can constrain inventory and alter RevPAR dynamics.
- Growth Trajectories vs. Stable Mature Markets
- In high-growth destinations, RevPAR can shift quickly as new supply comes online, airlift changes, or the market finds its price. Year-over-year comparisons can look dramatic even when the underlying demand is still building.
- In mature destinations, RevPAR is usually more incremental, and changes are more often driven by mix shifts, pricing power in peak weeks, and competitive positioning rather than rapid structural growth.
Tourism Profile and Traveler Demographics
Luxury vs. Value Segments
Luxury-heavy destinations can sustain higher ADR (and RevPAR) with fewer bookings, while value markets may win on occupancy and average length of stay.
Domestic vs. International Mix
Markets dominated by domestic drive-to travellers behave differently from markets reliant on long-haul demand, which is more sensitive to currency, flight costs, and geopolitics.
Business vs. Leisure Travel
Business-heavy markets often see stronger midweek patterns and shorter booking windows, while leisure-led markets tend to show more weekend/holiday concentration and longer planning cycles
This mix changes what good RevPAR looks like by shaping occupancy cadence, rate sensitivity, and demand timing.
Length of Stay and Spending Patterns
Longer average stays can lift occupancy efficiency and reduce turnover constraints, while shorter stays can boost rate flexibility but increase operational friction.
RevPAR captures room revenue performance, but pairing it with length of stay and booking window allows you to understand whether the revenue is driven by premium pricing, higher utilization, or compressed trip behavior.
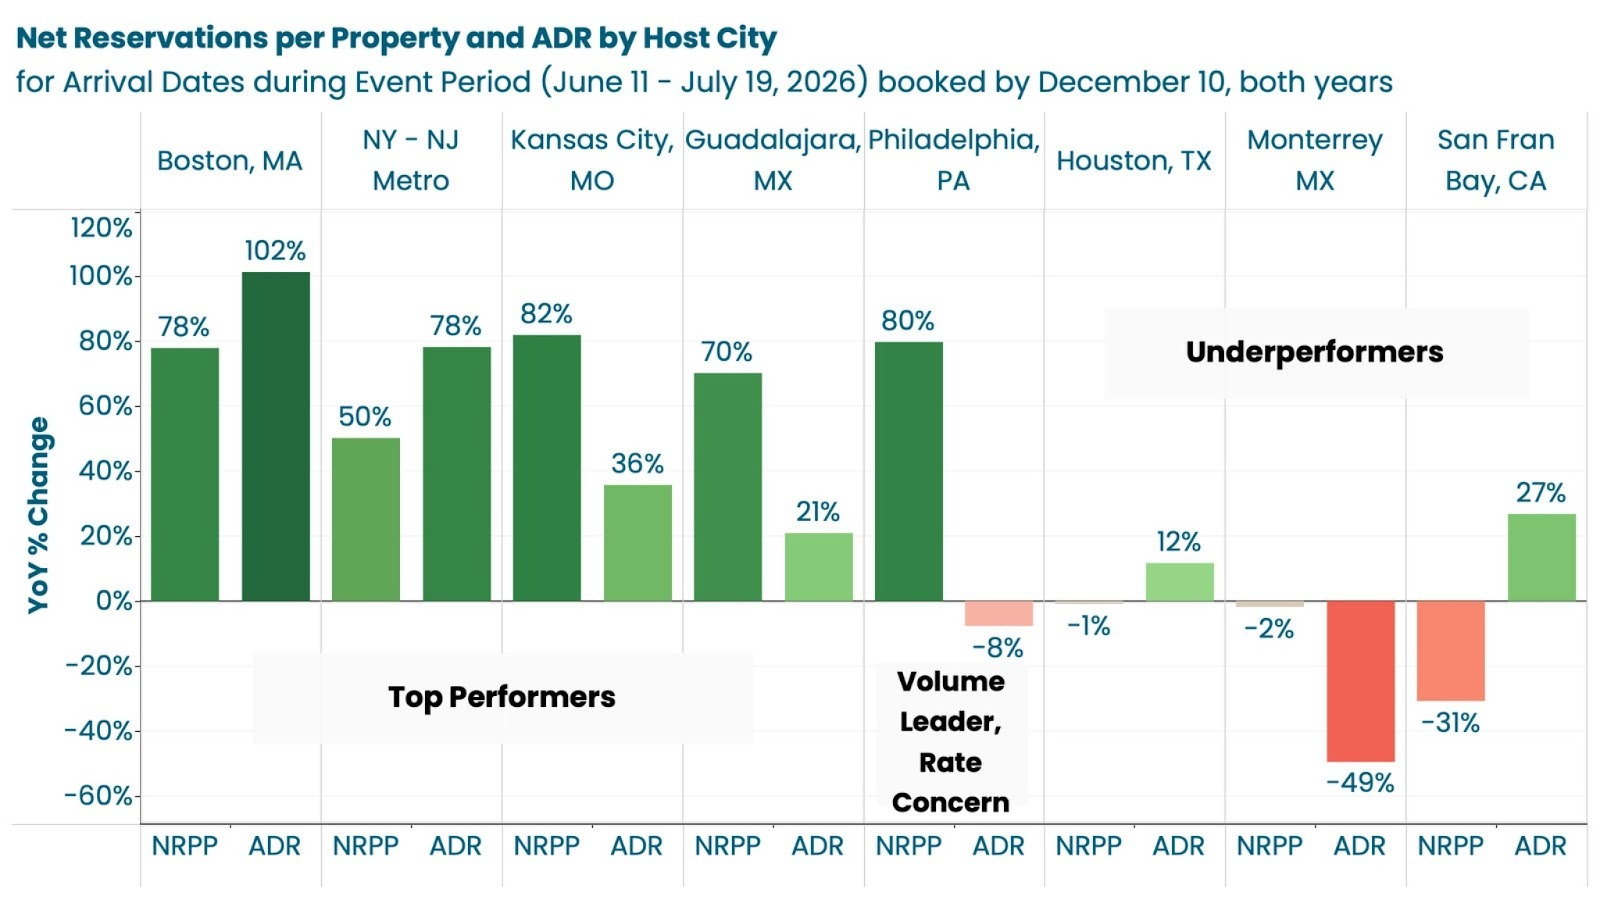
The FIFA World Cup 2026 schedule release shows how the same global event can produce sharply different outcomes by host market.
Seasonality and Climate Variations
Year-Round Destinations vs. Seasonal Markets
Comparing a peak month in one hemisphere to an off month in another will mislead destination reporting, even if both are summer calendar months.
Peak Intensity vs. Shoulder Performance
Some markets have one short, explosive peak; others have long, moderate peaks and dependable shoulder seasons. Event-driven demand can temporarily override normal seasonality and vanish quickly.
Importance of Fair Comparison
International RevPAR comparisons are more meaningful when you align equivalent demand weeks (peak-to-peak, shoulder-to-shoulder), and not just the same calendar months. It helps you compare the same demand moment, so you don’t end up mixing structurally different booking behaviors.
How to Contextualize RevPAR Across Different Economies
Adjusting for Cost of Living and Economic Context
- Define RevPAR
- RevPAR is a gross revenue signal. It does not reflect local labor, utilities, taxes, and operating realities.
- Use it as a benchmarking input, then pressure-test it against the local cost structure.
- Define Costs
- Local Wage Levels + Consumer Pricing: higher RevPAR can be normal where wages and prices are higher.
- Tourism Infrastructure Costs: Labor intensity, utility costs, and service expectations can change the definition of “good”.
- Operating Costs vs. Revenue: Review RevPAR alongside major cost lines (cleaning, maintenance, staffing, utilities) to avoid chasing top-line growth that erodes margin.
- RevPAR as Percentage of Local Economic Indicators
- Use price-level / purchasing power concepts to avoid false comparisons.
- Compare RevPAR alongside a price-level index within the domestic borders.
- For global context, use PPP to equalize the purchasing power of different currencies by removing price-level differences.
Identifying Appropriate Comparable Markets
- Build Comp Groups by Destination Type
- Beach resort vs. urban hub vs. mountain market.
- Accessibility, and how concentrated demand is around weekends, holidays, and events.
- Match Demand Mix Driving Pricing Power
- Similar traveller types (international-heavy vs. domestic-heavy).
- Similar trip purpose (leisure-led vs. blended with business).
- Match Maturity and Constraints
- Similar development stage (highly professionalized supply vs. fragmented).
- Similar regulation and inventory dynamics (how quickly supply can expand or contract).
- Use the “Miami vs. Bali” Test
- Miami and Bali are both leisure destinations, but differences in currency, wage structures, travel distances, and spending patterns shift what high RevPAR actually means.
- Miami vs. Cancún tends to be a cleaner starting point because the traveller profile and regional competition set are more comparable.
Understanding Regional Performance Bands
Avoid Fixed Global Targets
Create region-specific performance bands (e.g., 25th / 50th / 75th percentile) so a destination is judged against peers operating under similar economic and demand conditions.
This keeps targets realistic and reduces misreads caused by currency, cost structures, and traveller spend.
Expect:
- Mature Western European Markets: Often more stable demand patterns, with performance shaped by established tourism infrastructure and pricing expectations.
- Emerging Markets: Wider variance market-to-market; growth patterns can be strong, but volatility and infrastructure gaps can make a difference.
- Established North American Resort Markets: Seasonality and event calendars can create sharp peaks; performance bands should be built by season and not annual averages.
Using Multiple Metrics for Holistic Analysis
- RevPAR + Occupancy: Separates rate-led wins from volume-led wins.
- RevPAR + ADR vs. Local Economy: Checks whether rate growth is plausible for the traveller wallet in that market.
- Length of Stay + Total Guest Spending: Shows whether performance is driven by short-stay premiums or longer-stay-based demand.
- Booking Lead Times: Flags whether demand is early/committed or last-minute/fragile.
- Supply Growth vs. Demand Growth: Compares listings (supply) to booked nights (demand) to ensure rising RevPAR isn’t just a result of fewer available units.
Comparing RevPAR by lead time can help you distinguish early demand strength from late-cycle price spikes. In our America 250 analysis, we observed a national average booking window of ~331 days for the July 4th holiday week in 2026, suggesting long-lead planning for major holiday events.
Strategic Applications of International RevPAR Intelligence
Competitive Positioning and Marketing Strategy
- Avoid False Wins: Use international benchmarks to avoid “false wins” in which RevPAR looks strong on paper but is weak relative to similar markets.
- Learn From Peers: Use peer destinations (similar access, demand drivers, seasonality) to isolate what’s working elsewhere and test ideas locally.
- Spot Early Demand: Watch for demand shocks and booking-window extension moments that signal when travellers commit earlier than usual.
- Explain the “why”: Pair performance outcomes (RevPAR/ADR/occupancy) with context-based “why” (event calendar, air access, seasonality shifts).
- Set Performance Bands: Set targets using bands (best-case/expected/downside), and not just a single number, especially when FX and cost structures differ.
Tourism Development and Investment Attraction
- Benchmark for Investors: Show how your market performs against international peers on RevPAR, ADR, occupancy, and booking window, then translate that into investable narratives (stability, growth runway, seasonality resilience).
- Connect Market Scale: Travel represents a $2.9 trillion economic footprint and $1.3 trillion in spending, supporting 15 million U.S. jobs. Connect such market potential stats with local market performance to help the investors understand this scale.
- Prioritize Revenue Unlocks: Use performance outputs to prioritize what unlocks revenue (airlift, event venues, transport, visitor services), and not just what increases supply.
- Prove Resilience: Highlight pacing consistency, rate integrity, and performance during stress periods (storms, fires, regulatory shifts), rather than relying on one peak season.
Policy and Planning Decisions
- Test Capacity Limits: Compare RevPAR performance alongside occupancy and stay patterns to identify when growth is pushing infrastructure beyond sustainable limits.
- Set Sustainable Thresholds: Use peer destinations to set thresholds for acceptable peak compression, shoulder-season dependency, and supply expansion.
- Use Verifiable Signals: Ground regulatory conversations in verifiable market behaviour (pacing, booking windows, length of stay).
Stakeholder Communication and Reporting
- Translate Results: Translate “what happened” into “what it means” by explaining where RevPAR is changing, whether it’s rate-led or volume-led, and what’s driving the shift.
- Prevent Overreaction: Use pacing and booking windows to prevent overreaction to short-term market volatility.
Dex AI can help you convert portfolio and market signals into an executive-ready narrative that reduces analysis time and aligns your teams around a shared context.
Building a Framework for Ongoing International Analysis
International RevPAR comparisons only work when you combine clean, standardized data with local context. RevPAR can look strong on paper but mean something very different once you account for FX, cost structures, seasonality, and demand mix.
Making confident international comparisons requires access to reliable, standardized, and accurate data across global markets. Request a demo today to see how comprehensive destination intelligence can help you benchmark performance and support strategic tourism planning with real-time vacation rental insights.