


Key Takeaways:
- Choose a platform built on verified reservation data from PMS integrations to support defensible underwriting and portfolio monitoring.
- Treat integration readiness as a core requirement by confirming API/export access, enterprise delivery, and the ability to fit into your internal BI and reporting workflows.
- Evaluate enterprise fit end-to-end by checking validation methods, auditability, support, SLAs, security controls, forecasting signals, and total cost of ownership.
Institutional investors entering the short-term rental and alternative lodging space face a fundamentally different challenge than traditional operators—making capital allocation decisions with incomplete or inconsistent market intelligence.
Acquisition, underwriting, portfolio monitoring, and expansion strategy now depend on a reliable analytics platform capable of delivering defensible, investment-grade data and not just dashboards.
The U.S. REITs collectively own more than $4.5 trillion in gross real estate assets, demonstrating how institutional capital depends on accurate data to deploy and manage investments at scale.
At the same time, the underlying asset class continues to expand rapidly. The U.S. STR market was valued at $68.64 billion in 2024 and is projected to reach $102.86 billion at a CAGR of 7.4%, increasing both opportunities and risks for institutional buyers evaluating new markets.
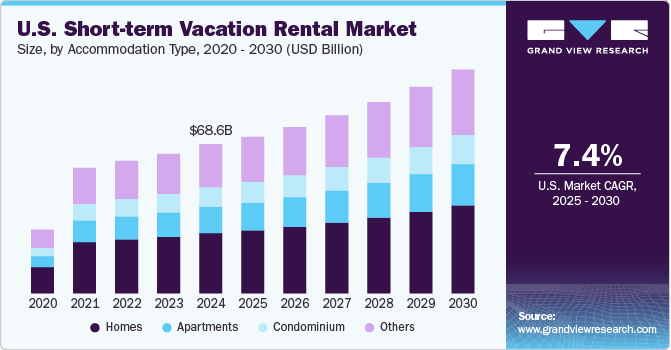
Source: Grand View Research
Many analytics tools were originally designed for individual operators or for pricing automation, not for institutional underwriting, portfolio governance, or investment committee scrutiny. Differences in data sourcing, geographic coverage, transparency, and enterprise integrations can materially change how an investment performs when capital is deployed.
In this article, we’ll review how to evaluate property analytics software using a framework built specifically for institutional investors.
What Data Source & Integrity Mean for Investment Decisions
Direct-Source vs. Scraped Data
As an investor, the first distinction you should examine is how market data is collected.
- Direct Source Data
- Scraped Data
- Estimated from listing calendars or advertised rates.
- Cannot confirm whether stays actually occurred.
- Many include owner nights or inactive inventory.
To make an informed decision, you need access to verified reservations that provide a clearer picture of market health than listing estimates. Platforms such as Key Data allow you to access aggregate performance intelligence through 65+ PMS integrations, enabling you to analyze real booking activity rather than inferred supply signals.
Data Cleaning and Standardization
Even verified data sets require refinement before they become reliable and investment-grade.
The platform you choose must account for:
- Abnormal pricing events or one-off demand spikes.
- Duplicate listings across channels.
- Incorrect geographic tagging.
- Occupancy distortion caused by owner stays or maintenance holds.
Strong analytics environments automatically normalize and validate performance metrics, so you can compare markets, portfolios, and comp sets on an apples-to-apples basis.
Audit Trails and Transparency
Analytics must withstand scrutiny beyond the asset management team.
Investment committees and LPs typically expect:
- Documented data methodology.
- Traceable data lineage.
- Reproducible calculations.
- Exportable data sets for internal models.
Platforms that provide conclusions without explaining data origins introduce unnecessary risks. Transparent analytics allows you to defend your decisions with evidence instead of estimates.
Key Capabilities of the Best Property Analytics Software
Geographic Coverage and Market Depth
As an institutional investor, you need to see the actual market trends, not just estimates and headlines. Start by validating whether a platform has enough depth in the exact submarkets you underwrite.
- Ask for property counts and historical depth in your target metros and submarkets.
- Look for neighborhood/ZIP-code-style views, plus flexible geo-framing so you can mirror how you actually define a comp set.
- Make sure the platform covers your lodging mix—vacation rentals, urban STRs, hybrid inventory—so your underwriting assumptions aren’t built on partial visibility.
Key Data’s benchmark layer is built on the actual performance of 700,000+ properties globally, sourced through 65+ PMS integrations, which supports deeper market filtering and more defensible comps.
Integration and Technical Capabilities
If your team runs proprietary underwriting models, portfolio dashboards, or investor reporting workflows, you need data mobility.
- Prioritize platforms that support bulk delivery, clean exports, and enterprise-friendly access patterns so your team doesn’t have to rebuild the same datasets manually every quarter.
- Embedded or white-label readiness is valuable when you provide standardized performance reporting or distribute market insights.
- For institutional-grade workflows, ask how fast they can deliver a new schema, new geography, or new segmentation without breaking downstream reporting.
Key Data’s EnterpriseData includes API, bulk integrations, and enterprise-grade delivery for investment use cases.
Enterprise-Grade Support and SLAs
As an institutional investor, you should treat analytics as operational infrastructure—especially during acquisition cycles, board updates, or lender reporting windows.
- Confirm uptime commitments, response times, and who owns incident resolution.
- Look for enablement that quickly aligns revenue, ops, and analytics teams—especially if multiple roles use the platform.
- At a minimum, expect role-based access, encryption, and documented control frameworks (SOC 2-style controls are commonly requested in vendor risk reviews).
Forecasting and Predictive Analytics
Forward-looking visibility can help you reduce underwriting risk and improve portfolio steering.
- Demand signals like pacing, booking windows, and demand indicators help you spot shifts earlier and pressure-test assumptions.
- Scenario planning can be useful for underwriting sensitivity (seasonality, regulation changes, supply shocks) and for explaining variance to stakeholders.
- Alerts and clean YoY comparisons can help your teams respond faster when a market breaks pattern.
Key Data’s DemandIQ® provides real-time and forward-looking traveler demand intelligence, supporting earlier reads on intent signals and booking behavior.
Alignment with Investment Use Cases
The best platform is the one that maps cleanly to how capital decisions and portfolio operators actually work.
- Acquisition and due diligence benefit from property-level comps, saturation context, submarket segmentation, and model-ready exports that support informed investment decisions.
- Portfolio monitoring relies on roll-ups across markets, performance alerts, and repeatable reporting to align internal and external stakeholders.
- Market research and strategy depend on long-range visibility into trends, a clear supply-and-demand context, and consistent market comparisons over time.
How to Evaluate Property Analytics Platforms
Questions to Ask During Demos
A strong platform should clearly explain how data is sourced, validated, and delivered into your workflow.
During a demo, ask questions like:
- Where does the data originate from?
- How strong is the coverage in our acquisition markets?
- Can we export or integrate the data?
- What enterprise capabilities are available?
- How flexible are the integrations?
- What forecasting tools are available?
Key Data’s EnterpriseData is designed to support institutional workflows by providing export-ready datasets and integration flexibility that fit existing investment processes.
Request Sample Data
Treat analytics software like any other investment input and test it against real use cases. Recommended evaluation steps are:
- Request data sets covering your target markets, and not just generic examples.
- Validate outputs against properties or portfolios you already understand.
- Ask for institutional or enterprise use cases demonstrating portfolio analysis.
- Run a trial period to confirm usability across asset management, revenue, and executive teams.
Testing scenarios can help you confirm whether the insights can translate into actionable understanding rather than mere surface-level reporting.
Evaluate Total Cost of Ownership
It’s not just the subscription price that reflects the true value of an analytics software; you should also consider:
- Platform subscription fees.
- Implementation and onboarding efforts.
- Training and internal adoption time.
- Integration or customization requirements.
- Ongoing support and maintenance.
Select the Right Analytics Platform for Your Investment Strategy
The best property analytics software isn’t the one with the longest list of features; it’s the one that consistently delivers accurate, scalable data aligned to your investment use cases, technical requirements, and portfolio strategy.
Prioritize platforms that provide:
- Verified performance data you can trust.
- Market depth at the submarket level.
- Export/API access that fits your internal models.
- Enterprise support, security, and implementation readiness.
As an institutional investor, you need enterprise-scale analytics built for investment-grade accuracy. Request a demo today to see how EnterpriseData can deliver direct-source reservation data, custom integrations, and predictive intelligence to support smarter capital deployment in the short-term rental sector.