


Key Takeaways:
- Destination intelligence can help you move from hindsight reporting to proactive decisions based on live lodging data and visitor signals.
- A complete lodging view combines hotel and short-term rental performance, preventing blind spots in capacity, pacing, and neighborhood-level impact.
- Credible, privacy-safe reporting can strengthen accountability by linking tourism activity to economic outcomes, community pressure points, and clearer ROI conversations with boards and local government.
Tourism planning has shifted from reactive reporting to a proactive, data-led strategy. The questions have changed from “What happened last quarter?” to “What’s changing now, and what should we do next?”
In 2024, U.S. travel and tourism generated about $2.9 trillion in economic output and supported more than 15 million jobs, making it a major economic engine for the country. At the same time, destinations are facing tougher competition, sustainability pressures, and rising demands for transparency from residents, boards, and local government.
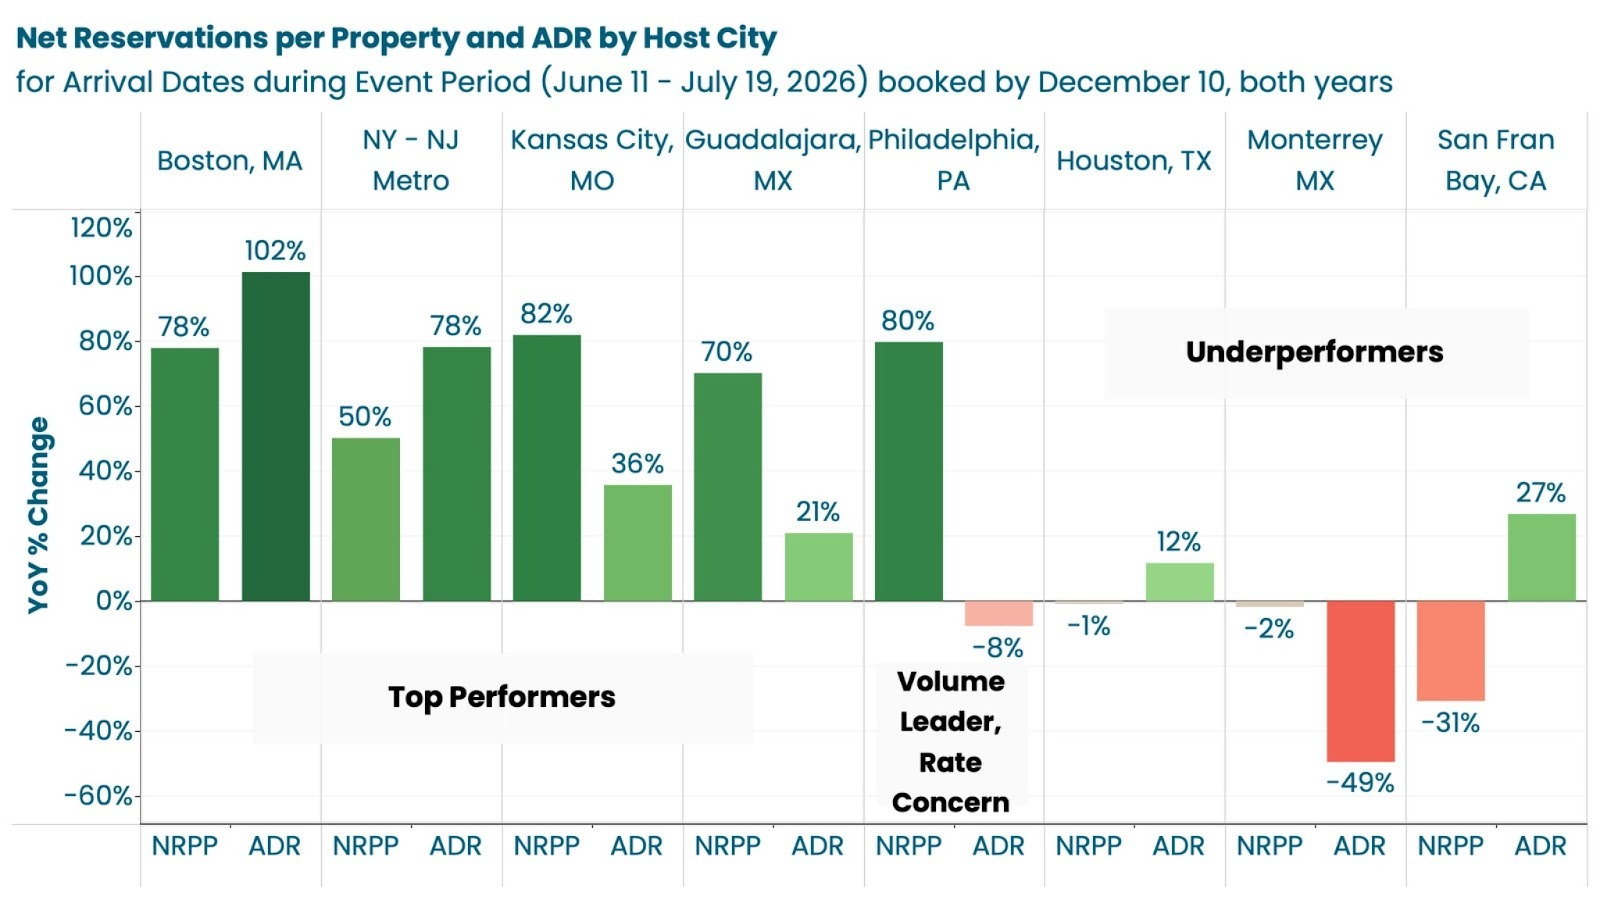
When the FIFA World Cup 2026 schedule was released, the market experienced an immediate surge in host-city performance, including higher reservations per property and ADR lifts, signaling how quickly demand can shift.
Destination intelligence brings hotels and short-term rentals into one clear view, so you can understand real demand, pacing, and visitor patterns, enablingbetter decisions across marketing, events, and planning with complete contextual information.
In this article, we’ll review what destination intelligence is, the core components behind it, and how you can use it to plan smarter, communicate performance clearly, and act earlier to capture the market demand.
What is Destination Intelligence?
Destination intelligence is the systematic collection, analysis, and application of tourism data so you can make decisions based on evidence, and not assumptions.
It’s a structured way to turn tourism signals into decisions, across visitor behavior, market dynamics, economic impact, and tourism trends.
It contains a holistic view of:
- Who Visits: Origin markets, segments, repeat vs first-time visitors.
- Where They Stay: Hotels, short-term rentals, neighborhoods, property types.
- What They Spend: Length of stay, spending patterns, seasonality.
- Impact of Tourism: Pressure points, distribution, sustainability.
It helps convert raw tourism data into actionable insights that inform:
- Strategy: Marketing focus, season planning, and event readiness.
- Policy: Regulatory decisions grounded in real market performance.
- Investment: Infrastructure, experience development, stakeholder alignment.
Key Data supports destination intelligence by providing market visibility and performance context. By providing the data and benchmarking context, our platform can help you make informed decisions.
The Core Components of Comprehensive Destination Intelligence
Accommodation and Lodging Data
- Hotel and Traditional Lodging
- STR Market Activity
- Supply and demand visibility that goes beyond what is publicly listed.
- Performance tracking based on actual booked behavior.
- Supply Dynamics
- Inventory growth, unit types, bedroom mix, and geographic distribution.
- New supply concentration that can shift tourism density and resident friction.
- Demand Indicators
- Occupancy trends, booking pace, booking window, length of stay, and cancellations.
- Event-driven spikes and shoulder season softness can be identified early.
- Revenue Generation
- Unit-level and market-level revenue contribution from lodging data.
- Market comparisons to see if growth is rate-led, volume-led, or balanced.
Having access to comprehensive lodging data can make a huge difference. If STRs are missing from your view, you can misread actual capacity, seasonality, and neighborhood-level impact.
Visitor Behavior and Demographics
- Origin Markets: Where visitors come from and feeder-market trends that guide targeting.
- Trip Characteristics: Length of stay, party composition, seasonality, and day-of-week patterns.
- Spending Patterns: What visitor demand likely supports across restaurants, retail, and experiences.
- Booking Behavior: Lead times and booking windows that inform when to run campaigns and when to hold budget.
- Travel Intent: Leisure, business, special-event travel, repeat visitation, and once-a-year peak behavior.
Economic Impact Measurement
- Direct Tourism Spending: What visitors spend near the destination, and where that spending concentrates.
- Impact on Employment and Wages: Jobs supported directly and indirectly by the fluctuation in visitor demand.
- Tax Revenue Generation: Occupancy taxes, sales taxes, and other tourism-linked receipts that support accountability.
- ROI: Attribution models that connect campaign timing and spend to forward booking and realized performance.
A National Park Service report from 2023 revealed that 325.5 million visitors spent $26.4 billion near national parks, supporting 415,400 jobs and $55.6 billion in economic output; lodging was the largest contributor, with $9.9 billion in output supporting 89,200 jobs.
Market Performance and Competitive Intelligence
- Peer Destination Comparisons: Market share, positioning, and performance vs comparable destinations and submarkets.
- Seasonal Performance Patterns: The normal baseline based on monthly averages and the neighborhood to detect anomalies.
- Event Impact and Effectiveness: Pre-event booking acceleration, event-week compression, and post-event tail effects.
- Forward-Looking Demand Indicators: Booking pace and lead-times shift that act as early warning signals for softening or surging demand.
After the FIFA World Cup 2026 schedule release, host cities reported an average increase of +29% in net reservations per property during the release week compared to the prior year, highlighting why forward-looking pacing is important in tourism planning.
Community and Infrastructure Context
- Tourism Density and Carrying Capacity: Visitor concentration by neighborhood and season, and where growth becomes strain.
- Resident Sentiment and Community Impact: Complaints, sentiment inputs, and pressure points that require transparent reporting.
- Infrastructure Utilization and Strain: Transport, parking, public services, and peak-day load signals.
- Environmental and Sustainability Metrics: Seasonality-driven impacts, sensitive zones, and sustainability initiative effectiveness.
- Geographic Distribution of Tourism Activity: Whether demand disperses or clusters, and how policy and marketing can shape the effect.
How Destination Intelligence Powers Strategic Tourism Planning
Evidence-Based Marketing and Campaign Optimization
Market Prioritization
Use occupancy and ADR pacing to identify where demand is strengthening or softening before you spend. Pressure-test hot narratives against real booking behavior (lead times, cancellations, length of stay).
Align Campaigns With Booking Windows
When booking windows extend, DMOs can bring forward messaging and partner readiness. For instance, our America 250 analysis shows travellers planning far ahead around the holiday week of July 4th, with booking windows sitting around ~11 months nationally.
Budget Allocation with ROI Logic
Tie channel and market spend to measurable outcomes (room nights, revenue lift, occupancy vs comp markets). Lean on reporting that’s defensible for boards and public stakeholders.
Tourism Development and Investment Attraction
Validate Opportunities With Supply-Demand Analysis
Identify where inventory growth is outpacing demand, or where demand is rising faster than supply. Use hotel data + STR visibility to avoid blind spots in feasibility narratives.
Build Investment Cases With Market Proof
Support infrastructure and development pitches with booking pace, seasonality, and revenue indicators. For instance, the 2025 Sundance Film Fest in Park City surged RevPAR by 72% and ADR to $810, showing how major events can reshape lodging performance.
Align Product Development to Visitor Patterns
Use length of stay and seasonality patterns to guide experiences, packaging, and dispersal strategies.
Policy and Regulatory Decision-Making
Use Actionable Market Data
Ground your STR policy, zoning, and enforcement priorities in actual occupancy density, supply distribution, and performance trends.
Model the Impact of Policy Changes
Use before/after pacing and revenue indicators to evaluate outcomes and iterate without politics driving the narrative.
Optimize Tax Policy
Link lodging activity to tax implications using measurable stays and revenue signals.
Stakeholder Communication and Accountability
Transparent Reporting
Share a consistent set of KPIs with clear context: what changed, why it likely changed, and what your next steps are.
Shared Visibility With Partners
When destinations can show credible demand shifts, your peers and PMCs can staff, market, and forecast more confidently.
Key Data’s Dex AI can analyze complex portfolio signals and convert them into actionable insights to help you strategize your next move.
Sustainability and Carrying Capacity Management
Monitor Tourism Intensity
Track demand concentration by neighborhood and season to spot pressure points early.
Identify Risks of Overtourism
Use pacing and booking-window shifts as early-warning signals and redirect accordingly with your partners.
Measure Dispersal Effectiveness
Compare performance outcomes in target zones against the baseline areas, then refine your strategy with proof.
Technology and Innovation: The Future of Destination Intelligence
Real-Time Data and Agile Decision-Making
Adapt Dashboards
Replace retrospective year-end reporting with always-on performance views (pacing, booking window shifts, source mix, and occupancy trends). Use dashboards as an operating rhythm for your teams and your lodging partners.
Proactive Response to Market Shifts
The NTTO data reported that international visitors spent more than $20.6 billion in July 2025. Track demand inflection points tied to announcements, weather disruptions, airlift changes, and major events.
Adjust Strategy Based on Current Conditions
Reallocate campaign focus by origin market and travel window when forward signals soften or spike.
Crisis Response and Recovery Monitoring
Monitor booking cancellations, lead-time compression, and demand recovery by submarket after disruptions (storms, fires, infrastructure outages). Use transparent-reporting to communicate recovery progress.
Predictive Analytics and Forecasting
Adapt Forward-Looking Intelligence
Shift from historical reporting (“what happened”) to forward-looking data (“what is likely next”) using booking pace, booking window changes, and search intent signals.
Forecast Demand
Forecast peak-period strain by neighborhood and season to plan transport, public services, staffing, and visitor services.
Set Early Warning Systems
Set alerts for anomaly shifts (pace dips, sudden divergence in ADR/occupancy, channel mix changes, or event-week compression).
Use Predictive Models
Plan for different potential scenarios using predictive models and “if-then” conditions for events, regulatory changes, and disruption recovery.
Understand Booking Intent
Combine early indicators (search demand, lead-time extension, feeder market movement) to anticipate future demand.
AI and Machine Learning Applications
Signal Stitching
Use ML to connect signals across lodging, events, marketing, and mobility data, so your teams can see what’s driving performance, and not just what has changed.
Outlier Detection
Flag outliers (submarkets or property segments behaving differently from the broader destination) for investigation and targeted action.
Sentiment Insights
Analyze resident sentiment and visitor feedback at scale to understand pressure points and opportunities.
Automated Insights
Automate alert systems and insight generation with Dex AI to interpret portfolio performance and surface “what’s working, what needs attention, and next moves”.
Segment Targeting
Use intelligence to tailor messaging and dispersal strategies by visitor segment, season, and neighborhood capacity.
Integration and Data Ecosystem Development
Connected Journey View
Build a shared picture that ties lodging performance to what visitors do next (attractions, restaurants, transport usage, and event attendance).
Shared KPIs
Enable common definitions and aligned KPIs across DMOs, municipalities, and professional property management companies.
Privacy-Safe Sharing
Publish controlled, privacy-safe feeds for internal teams and approved partners to reduce reporting lag and manual reconciliation.
Single Source of Truth
Make data usable across teams by standardizing metrics, definitions, and refresh cadences so stakeholders can act on a single shared truth.
Creating a Culture of Data-Driven Decision-Making
Destination intelligence can only deliver value when the underlying data is complete, current, and comparable. If your inputs are delayed, inconsistent, or missing major lodging segments, you’ll end up optimizing narratives and not outcomes.
Access to the latest destination intelligence can move you from reactive destination management to proactive tourism leadership.
Building comprehensive destination intelligence starts with complete visibility into your tourism market. Request a demo today to discover how real-time lodging data, visitor behavior insights, and forward-looking analytics can strengthen planning and stakeholder communication.