


Everyone follows a little different path when it comes to developing and setting their revenue management strategies. However, in this quick article we’ll discuss some of the basics that will set you up for success. Follow each of these three steps to help define your expectations, track performance, and course correct when necessary.
- Break your Portfolio into Categories:
If you have more than 25 units, it can be hard to keep up with what the expectations should be for your property portfolio. Imagine trying to understand and track 75 individual units that are all so very different. If you can spend the time to break them up into smaller categories, then they will be easier to manage.
Here are some examples:
- 1-2 Bedroom Condos
- Lakefront Standard Homes
- First Row Beach Villas
Start Simple, Categorize by Location and Quality:
- Downtown GOLD: My top performers
- Downtown SILVER: Middle of the road
- Downtown BRONZE: Lower end inventory
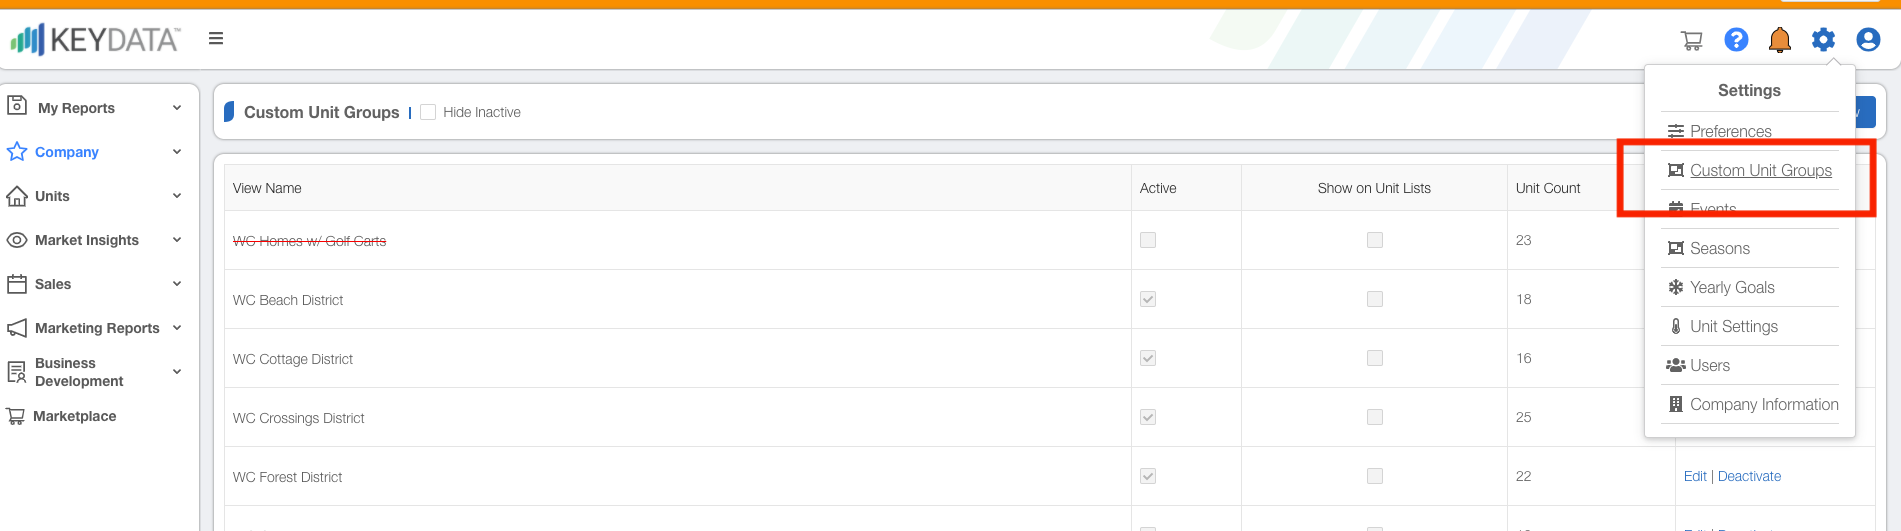
In your Key Data Dashboard, create “Custom Unit Groups” for each of your categories, this will allow you to easily view, compare and forecast performance. After creating your Custom Unit Groups, you can find them in the Filters Section of the dashboard. You can also view Custom Unit Group performance in a table format through our Unit Groupings Report.
- Set Your Seasons:
Now that you have a manageable set of categorized units, let’s talk about expectations for different seasons. Most vacation rental markets have seasonal revenue changes, meaning prices will be different during different times of the year-- peaks and valleys. Knowing this, it makes sense for you to develop and input your seasons into your Key Data Dashboard.
Again, if you don’t already have clearly defined seasons developed, start simple. Remember that you can always add on to your plan down the road. The hardest part is getting started. Here are some examples of simple starting points:
- Spring
- Summer
- Fall
- Winter
- High Season
- Mid Season
- Low Season
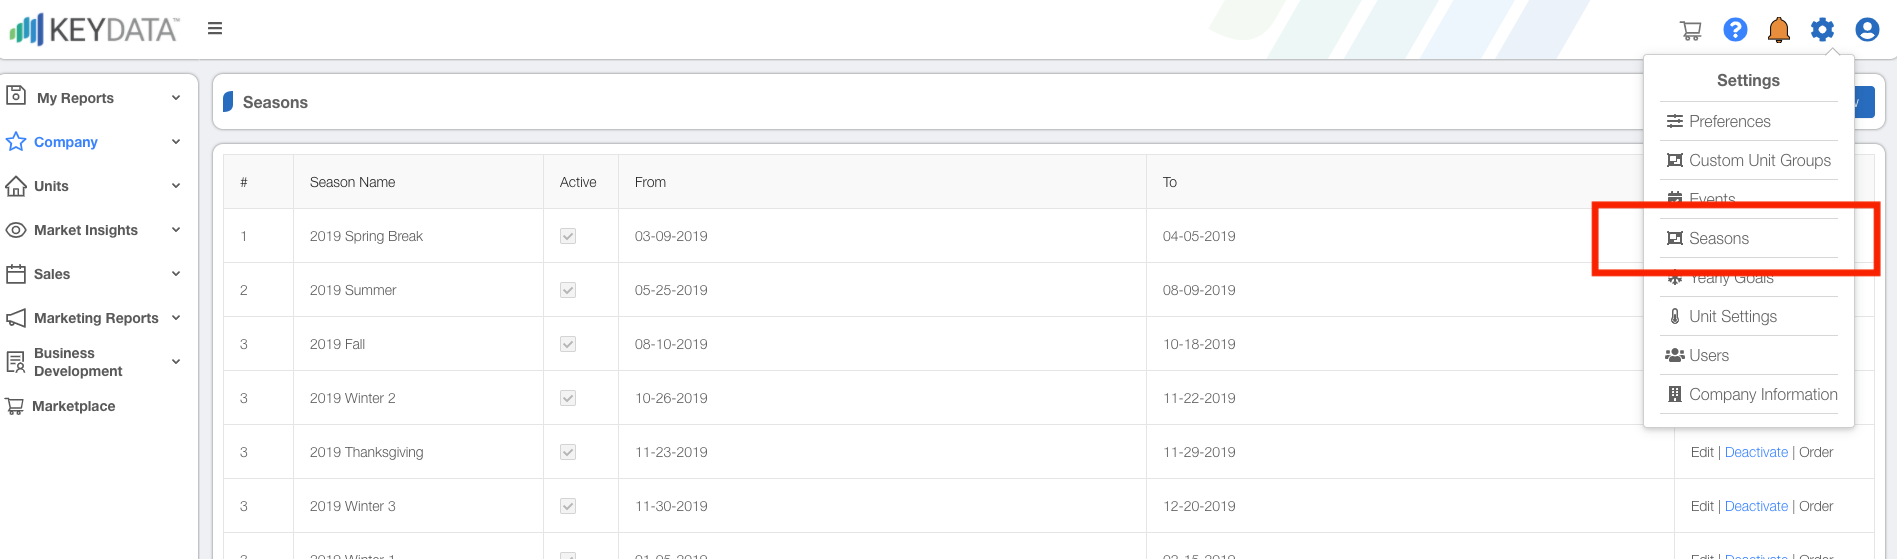
In your Key Data Dashboard, you can easily add these date ranges in as “Seasons.” This will save you time and effort when you begin to navigate back and forth the check performance. Once “Seasons” have been entered, go to the Date Picker in your dashboard and use the dropdown selection box to find your newly entered “Seasons.”

- Develop Your Expectations:
Now is the time to begin to develop your expectations for each of the Custom Unit Groups based on the Seasons you’ve created. The best way to develop your expectations is by analyzing historical performance. Here are some questions you should be asking yourself about each of these unit groups:
- When does my guest begin booking this unit group for this particular season?
- How many days in advance of the arrival day?
- What factors play into this decision?
- Do I have any restrictions that create a conflict for my guest (rates not available, closed calendar, minimum stay restrictions)?
- When do I receive the majority of my bookings for this unit group and season?
- What’s my average booking window?
- Has my average booking window changed historically?
- Is my average booking window dependent on outside factors: school dates, weather, promotions, announcements?
- Do I book solid or continue to receive reservations up to the arrival date (last minute reservations)?
- If I’m booked solid am I priced appropriately?
- If I continue to make reservations up to the arrival date, is it discount related, discount dependent, or is it simply related to supply and demand?
Use your Key Data Dashboard to help answer these questions with the following reports:
- Booking Curve:
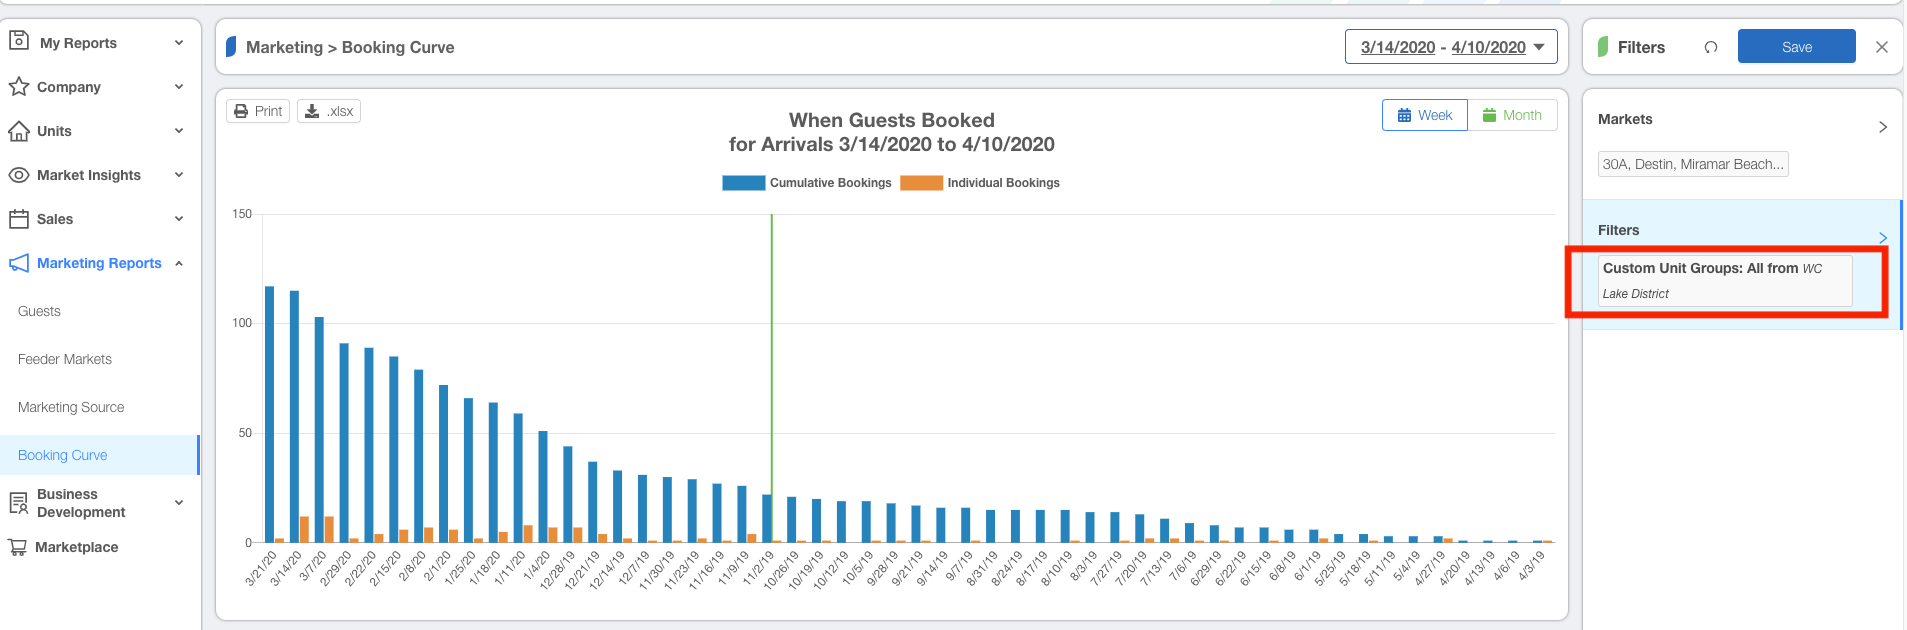
Select your Custom Unit Group and Season to see when you take your first reservations. You can also begin to analyze how many bookings you should have during the range from the first booking to the arrival date. Use this information to set your expectation for future bookings.
Example: If I historically have 100 reservations total for this Custom Unit Group during a particular Season, at what point should I expect to have 25% booked, 50% booked, 75% booked, etc.? If I am ahead or behind that expectation, I should consider increasing or decreasing my rates in order to throttle demand. Set guideposts for yourself so that you can refer back to them and make easy course corrections that are based on your data.
Here’s an example of a Booking Curve. Notice that you read the information from right to left. The far right of the visualization will be the first reservation taken for the selected “Season” (arrival date).
Additionally, you can use the “Average Booking Window” in your Pacing Detail Report to see when the majority of your reservations have been historically booked for a Season. Average Booking Window is a KPI that can be selected from all the visualization reports. By knowing the Average Booking Window for a particular Season and Custom Unit Group, you can easily set your 50% guidepost when projecting future bookings.
Here’s and example of the Pacing Detail Report with “Average Booking Window” selected as the KPI:
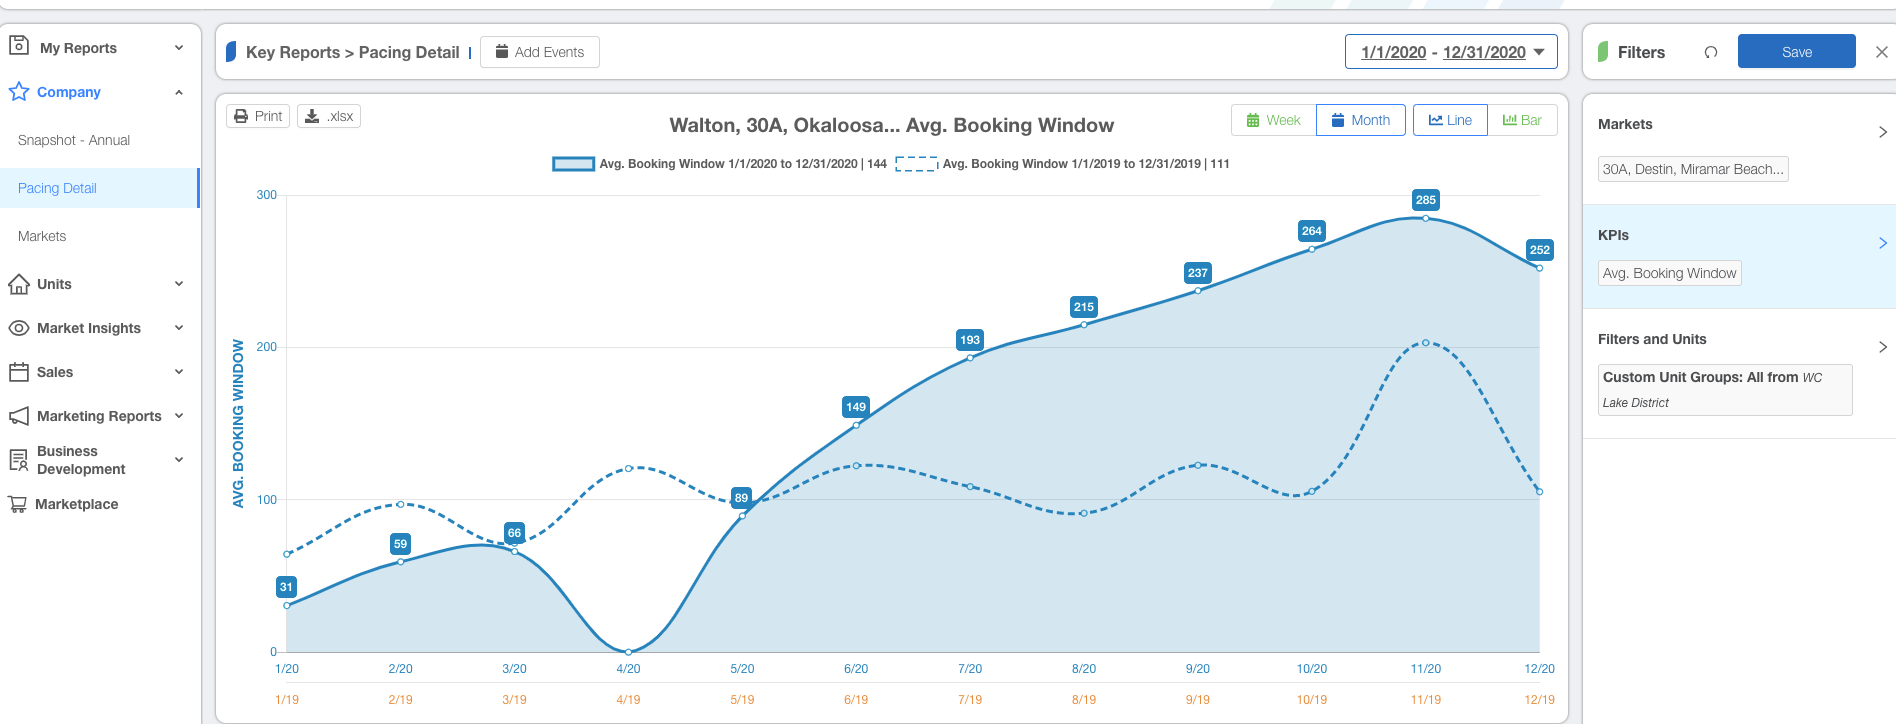
In this example, we can see that the Average Booking Window for this particular Custom Unit Group for the month of March has been consistent for the past two years - 66 days. This means that on average guests that stay in the month of March booked 66 days prior to their arrival. This means that some booked well in advance, some maybe booked very last minute, but the majority of bookings happened 66 days prior to arrival. This is your halfway mark for your total reservation count and as we discussed earlier, a very simple guide to follow.