


Key Takeaways:
- Public STR calculators often use scraped listings, while first-party reservation data provides verified, reliable insights.
- Reliable projections depend on occupancy, ADR, RevPAR, seasonality, booking windows, and comparable property benchmarking.
- ADR x occupancy x days in a month gives a baseline, but adjustments for expenses, owner stays, and market conditions are crucial.
- With filters, 40+ KPIs, DemandIQ®, and homeowner-ready reports, you can get market-specific, actionable forecasts.
- Validate estimates with multiple data points, monitor pacing, update forecasts regularly, and benchmark accurate comps.
Estimating short-term rental (STR) income is a crucial step if you’re considering an investment in vacation rentals. If you’re a property owner or an investor, you’d understand that projections aren’t just mere fluctuating numbers; they help with:
- Setting realistic expectations before listing a property.
- Modelling ROI and cash flow to inform investment decisions.
- Justifying conversions or acquisitions by validating projected performance.
The U.S. vacation rental market is expected to generate $22.11 billion in revenue by the end of 2025, and its continued growth is projected to reach $29.13 billion by 2030. This growth signals both opportunities and competition.
If you’re an investor or a property owner working with a property management company, accurate income estimates can help you gain the market insights you need to set realistic expectations, build dependable cash flow models, and validate strategic moves like STR conversions or portfolio expansions.
In this article, we’ll review how the short-term rental income estimator works, what data points determine its accuracy, and how you can identify the tools that deliver the most trustworthy insights.
What Is a Short-Term Rental Income Estimator?
A short-term rental income estimator is a tool that forecasts potential earnings for a vacation rental using market data and built-in metrics, such as:
- Estimated Average Daily Rate (ADR), occupancy, and seasonality trends.
- Monthly and annual revenue projections, based on comparable properties.
- High- and low-earnings scenarios, tailored to different property types (e.g., studio flat vs. four-bedroom home).
Publicly available estimators, such as Airbnb’s built-in calculator, AirDNA’s Rentalizer, Mashvisor, and Rabbu, can help you get a quick sense of opportunity, but they aren’t always reliable. They depend on scraped listings rather than actual booking records, which can skew results. That’s where the accuracy of those tools begins to fall short.
This is where the distinction between scraped data and first-party reservation data becomes critical. Scraped tools may show occupancy or revenue figures, but they can’t separate owner stays, maintenance holds, or blocked calendars.
For example, in Miami during the summer of 2025, both scraped and direct data sources reported 46% occupancy, but only first-party data revealed the breakdown:
- 38% paid guest nights
- 7% owner nights
- 1% maintenance holds
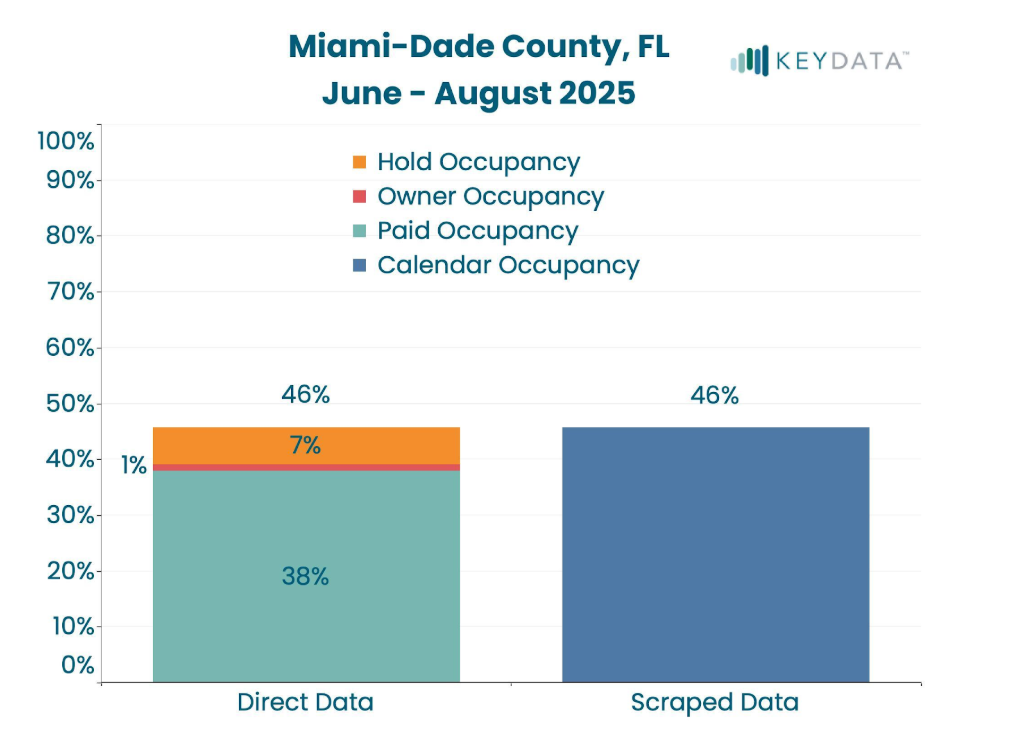
That 8% swing can distinguish between a realistic and misleading projection. Relying only on scraped estimates puts you at the risk of estimating inflated ADR, overstating revenue, and missing critical insights like booking windows and guest origins.
The Problem With Scraped Data and Public Calculators
Many public tools rely on scraped listings data, but those include several accuracy pitfalls:
- They pull from online listings, not confirmed bookings—so estimated rates can be inflated or outdated.
- Scraping can capture duplicate listings or unrealistic rates, skewing averages.
- Public calendars don’t account for blocked dates or unbooked nights, which can lead to misleading forecasts.
- Scraped tools often ignore lead time, pacing, and channel performance differences, missing the complete picture.
Forecasts built on such scraped data can be misleading. However, first-party reservation data can give you the real-time insights you need to make informed decisions.
At Key Data, we connect you directly to 65+ property management systems (PMS), tapping into real reservation records instead of mere assumptions. Allowing you to gain access to:
- Projections that reflect actual booking behavior and not just posted availability.
- Forecasts that account for real occupancy pacing and revenue trends are more reliable.
What Accurate STR Revenue Projections Should Include
Reliable short-term rental income estimators are built on multiple interconnected metrics—each offering a clearer, more actionable insight into performance. Here’s what you should look for:
- Actual Occupancy Rates
- The percentage of nights booked reflects actual rental demand, not just listing interest.
- Accurate occupancy data helps avoid overestimating potential revenue.
- Average Daily Rate
- ADR measures the average revenue earned per night.
- It reflects pricing effectiveness, but on its own, it doesn’t account for the property's booking frequency.
- Revenue per Available Rental Night
- Combining ADR and occupancy, RevPAR shows real earning power per night, regardless of the vacancy.
- It’s the gold standard in measuring revenue performance.
- Booking Window and Lead Time
- This defines how far in advance guests make the bookings.
- Knowing whether your market books 60 days ahead or a week can shape demand forecasting, which is vital for pricing strategy and seasonal prep.
- Seasonality Trends
- Seasonal demand patterns define when rates can be raised and discounts may be needed.
- Studies show that areas with high seasonal housing use (vacation homes) can experience wide occupancy swings, such as Provincetown, MA, where 57% of housing is seasonally vacant.
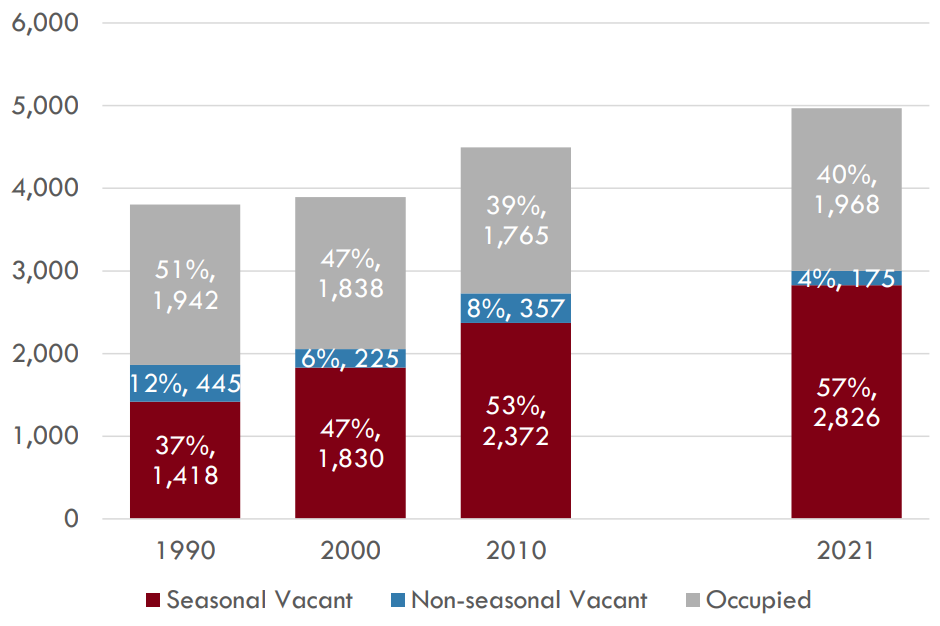
Source: UMDI Report
- Cancellation Rates
- Last-minute cancellations can distort availability.
- Accurate estimators account for typical cancellation behavior to avoid revenue fluctuations.
- Market Benchmarking (Comp Set Performance)
- Comparing your property to similar ones nearby—by type, size, and amenities—offers context and competitive insights.
- It ensures that your projections are realistic and reliable.
- Property Type and Bedroom Count
- The performance of a STR unit varies based on the total rooms and the kind of property.
- A 4-bed house will naturally attract longer stays and different seasonal patterns than a studio apartment.
- Length of Stays (LOS) Trends
- Understanding how long your guests will stay can help weigh your projections.
- Insights from post-pandemic data show stays now average 4.1–4.4 nights, up from 3.7 pre-pandemic—highlighting how extended stays are reshaping revenue strategies.
How to Calculate Short-Term Rental Income
When you’re managing a property or planning on investing in one, it’s often helpful to validate projections or run early-stage numbers manually. A simple formula can provide a quick baseline:
Estimated monthly STR income = (ADR) x (occupancy rate) x (number of days in the month)
- ADR (Average Daily Rate) = the nightly rate you expect to charge
- Occupancy rate = the percentage of booked nights
- Number of days in the month = total nights available for booking.
For example, if your ADR is $200, occupancy is 70%, and there are 30 days in the month:
$200 x 0.70 x 30 = $4,200
This projection represents gross revenue, before subtracting operating expenses, management fees, or platform costs.
Adjusting for Real-World Conditions
While the formula provides a starting point, reliable projections need to account for additional factors:
- Property Management Fees: Many management companies charge between 20% and 50%, depending on property type and services provided, for each booking, which can significantly reduce your investment's net income.
- Cleaning and Maintenance Costs: Frequent guest turnover means recurring cleaning fees and routine upkeep that add up over time.
- Taxes and Insurance Obligations: Local lodging taxes and specialized STE insurance policies are necessary expenses that impact profitability.
- Dynamic Pricing Variability: Rates rise during peak travel seasons and drop in off-season months, so income potential can shift dramatically throughout the year.
- Owner Stays: When the property owners block out nights for personal use, those unavailable dates directly reduce revenue potential.
How Key Data Supports STR Income Estimation
The accuracy of a projection comes down to two crucial factors: the quality and reliability of the STR data.
Unlike public calculators that rely on scraped listings, our ROI calculator connects directly to 65+ property management systems (PMS) and booking platforms to pull first-party reservation data. Which means that every projection you get is based on real booking data, rather than assumptions.
Smarter Rental Projections with Real Data
Key Data’s rental projection capabilities allow you to move beyond averages and build refined projections with property-specific forecasts:
- Filter by market, property size, and bedroom count to get a fair comparison between properties (based on their types). For example, projections are drawn only from similar properties in the neighborhood when estimating a four-bedroom home.
- Scale projections based on condition and amenities. For instance, a newly renovated property can be benchmarked at the higher end of revenue, while a condo with fewer amenities may be forecasted at a lower level, but the projections would reflect realistic market performance.
- Account for anomalies, like hurricanes or wildfires, by selecting different historical years to benchmark against.
- View seasonal revenue swings between seasonal and off-season months to build a realistic cash-flow model.
- Factor owner stays by adjusting nights blocked for personal use, so revenue projections align with the property’s actual availability.
- Break down projections month by month, showing expected revenue swings (e.g., & $18,000 in peak summer vs. $1,200 in off-season year-end) and average booking windows by season.
- Export homeowner-ready PDFs or adjust projections manually to set expectations with prospects.
Beyond revenue projections, our advanced integration capabilities provide you with access to 40+ KPIs updated daily—from ADR and RevPAR to pacing, cancellation, and booking windows.
Paired with our proprietary DemandIQ®, you can gain predictive insights into traveler demand before bookings occur, allowing you to anticipate shifts and adjust pricing strategies.
By combining various specialized tools, Key Data enables you to validate investment decisions and strengthen communication with owners.
Tips for Using Revenue Estimates to Inform Strategy
Revenue projections are valuable only if you know how to apply them. Here are some practical ways to use these estimates to make informed decisions:
- Validate Using Multiple Data Points
- Don’t rely entirely on ADR. Cross-check with occupancy, RevPAR, booking windows, and cancellation patterns to build a well-rounded forecast.
- Supply and demand in seasonal housing markets are highly variable, which makes multi-metric validation critical.
- Benchmark Against True Comps
- Always compare your property against similar homes in the same area—exact bedroom count, similar amenities, and similar conditions.
- A newly renovated four-bedroom home performs very differently from a dated condo, even within the same market.
- Monitor Pacing and Demand Compression
- Monitor how quickly nights are booked (pacing) and whether supply tightens during peak seasons (demand compression).
- These insights help you adjust rates proactively rather than reactively.
- Incorporate Forward-Looking Insights
- Data on booking windows and lead times reveal when travelers are likely to commit.
- If your market is trending toward shorter booking windows, dynamic pricing and marketing campaigns may need to be adjusted accordingly.
- Update Your Forecasts Regularly
- A projection is not a “set it and forget it” exercise.
- Revisit your estimates quarterly or monthly, layering in actual performance data and adjusting for shifts in demand, regulations, or external events.
Smarter Projections Start With Smarter Data
A short-term rental income estimator is only as reliable as the data that powers it. Public calculators and scraped listings can give you a quick overview, but they often miss the nuances that matter, such as true occupancy, pacing, and guest behavior.
First-party reservation data can give you the latest and real-time insights. By pulling directly from 65+ property management systems, Key Data delivers the most accurate, market-specific projections available, allowing you to plan with confidence, knowing that your forecasts are based on actual bookings and not mere assumptions.
Ready to explore a realistic picture of how your short-term rental could perform? Contact us now and learn more about how Key Data can help you confidently forecast revenue.