.png)


Key Takeaways:
- Underperforming vacation rentals are easier to spot when you start with the leaderboard views that rank units by revenue, RevPAR, and occupancy instead of relying on portfolio averages.
- The KPI cascade can help you diagnose performance issues in sequence by reviewing revenue gaps, occupancy variance, ADR, owner nights, and booking behavior before taking action.
- Not every weak result is a pricing problem because listing quality, amenities, marketing exposure, guest feedback, and owner usage can also affect performance even when the KPIs look normal.
Gut feel is expensive. When decisions are driven by instinct instead of data, the wrong properties get attention while real performance issues stay hidden.
In a market where even small inefficiencies compound across dozens (or hundreds) of units, guessing isn’t just risky, it’s expensive.
As portfolios grow, it becomes impossible to evaluate every unit with the same level of scrutiny. A portfolio might look healthy at a high level, but that average often masks underperforming properties quietly dragging down overall revenue.
The U.S. vacation rental market is projected to reach $20.57 billion by 2027, driven by continued demand and competition. In such an environment, knowing how to identify underperforming vacation rentals is a core operational skill.
Instead of relying on surface-level metrics or reactive decisions, KPIs provide a repeatable, defensible diagnostic framework that isolates underperformance step by step.
In this article, we’ll review how to apply the KPI cascade from portfolio-level screening to unit-level diagnosis, and how to use data to understand market changes.
Why Do Leaderboards Matter for Portfolio Performance?
Finding Outliers Fast
At scale, the biggest risk isn’t missing data, but missing what matters the most. Leaderboards can help you rank every unit against the same performance metric, making outliers immediately visible instead of buried in spreadsheets.
When you sort by RevPAR, occupancy, or revenue variance, patterns surface quickly. Units that are pacing behind their competitive set stand out, while top-performing units help you confirm what’s working.
This allows you to focus your time on properties that have the highest impact; those that are underperforming relative to the market, not just underperforming in isolation.
Short-term rental demand in the U.S. grew by approximately 7% year-over-year in 2025, outpacing supply growth of 4.7%, highlighting the shifts in demand patterns. In a tightening market like this, identifying underperformers early is the difference between capturing demand and missing it.
Separating Portfolio Health From Unit Health
Portfolio averages can be misleading. A strong overall RevPAR or occupancy figure can hide a long tail of underperforming units that quietly dilute total revenue. Without a clear way to isolate those properties, you risk optimizing the portfolio at the surface level while leaving deeper inefficiencies untouched.
By breaking performance down at the unit level, leaderboards reveal where your portfolio health diverges from unit-level reality and provide a prioritized path for investigation.
KeyData’s ProData lets your teams filter performance by dimensions like bedroom count, location, and property type, keeping comparisons relevant.
What Is the KPI Cascade Framework?
The KPI cascade is a structured diagnostic framework that moves from symptoms to root cause.
Instead of reacting to a single metric, it forces a structured review where each KPI narrows the problem further, until you not only see the what, but also the why behind underperformance.
Step 1 – Revenue Gap
Start with the outcome by identifying which units show the largest variance in total revenue compared to their true competitive set, filtered by bedroom count, location, and property type.
This step flags where the problem exists, but it doesn’t explain it. A revenue gap is a signal, not a diagnosis. The rest of the cascade breaks that signal down into actionable insights.
Step 2 – Occupancy Variance
Identify whether the issue is demand-driven. Are these units booking fewer nights than comparable properties?
Units with lower occupancy relative to their comps often point to friction in availability, listing visibility, or demand capture. Occupancy in the U.S. market grew by over 7.2% year-over-year in early 2025, suggesting that underperformance is more likely tied to execution than to a lack of demand.
Step 3 – ADR Comparison
If occupancy is in line with the market but revenue still lags, pricing becomes the next variable to evaluate. Compare ADR against a like-for-like competitive set and not the portfolio average.
A unit can appear healthy on bookings while still underperforming financially. In many cases, the issue isn’t demand, but that the property is filling at below-market rates, leaving revenue on the table.
Step 4 – Owner Nights and Holds
Before drawing any conclusions, adjust for availability. Owner stays and hold nights directly reduce bookable inventory and can distort occupancy metrics.
A unit may appear to underperform on occupancy, but once owner usage is removed, its booking performance may align with or even exceed the market. Ignoring this step can lead to incorrect assumptions and unnecessary adjustments.
Step 5 – Booking Behavior Signals
Look at how the unit is booking, not just how much. Metrics such as booking window, lead time, and length of stay indicate whether the property is attracting the right type of demand.
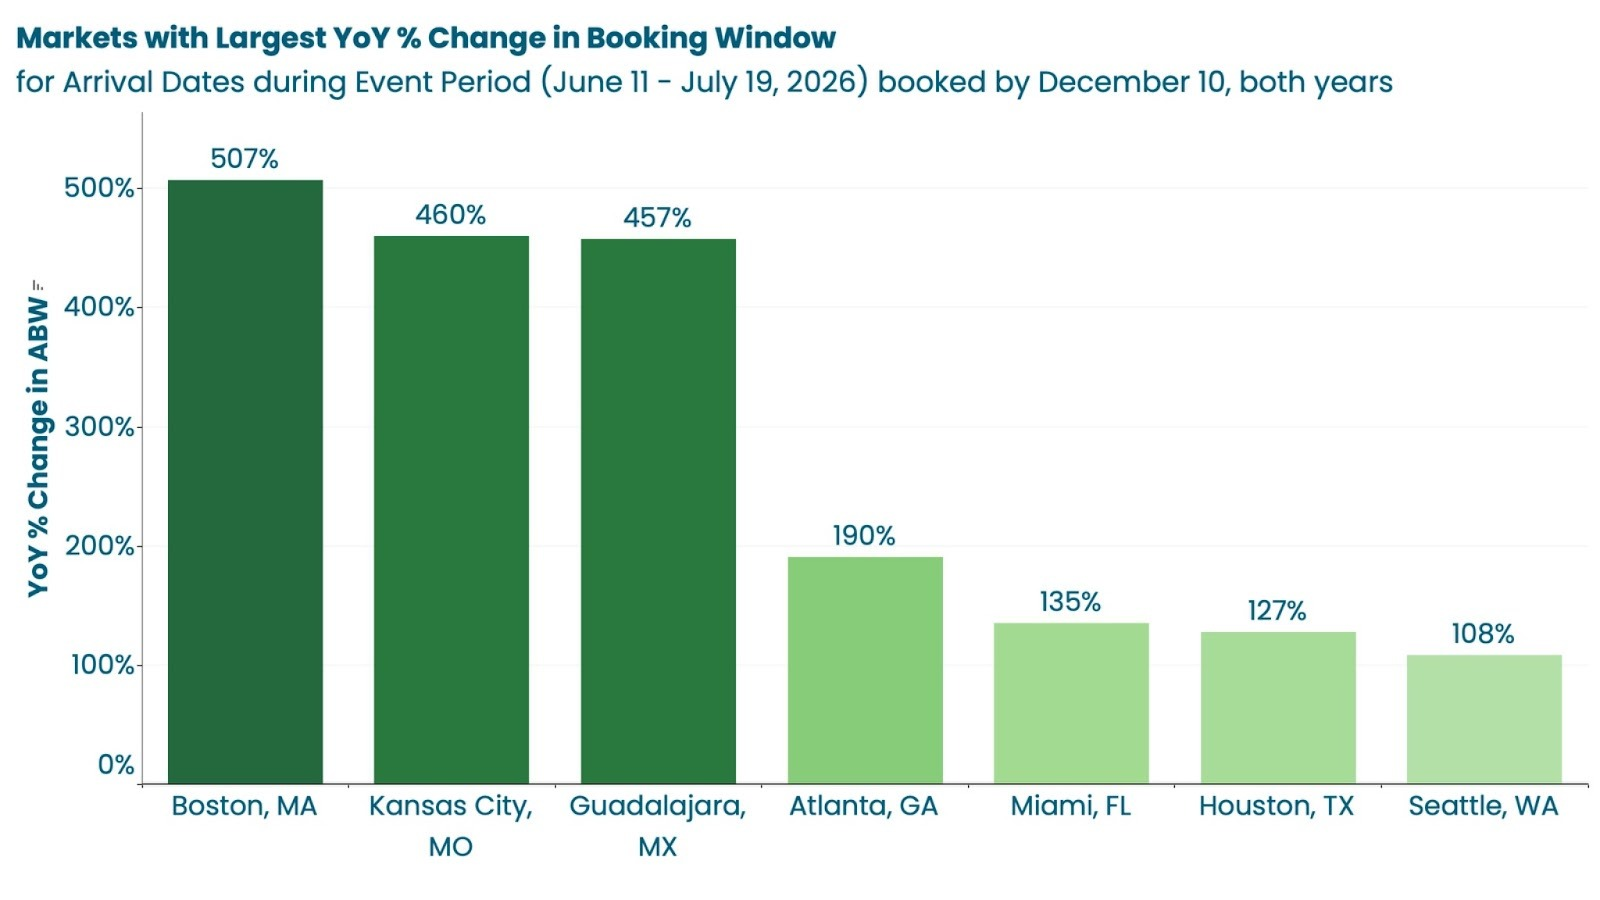
Shifts in booking behavior can become more pronounced in event-driven markets. For instance, during the FIFA World Cup 2026 schedule release, booking windows in urban markets expanded to 120+ days in advance, compared to the typical 25–35-day windows.
When booking patterns deviate from market signals, it often indicates a mismatch in positioning or pricing before occupancy declines.
With KeyData, you can access booking and behavioral metrics alongside occupancy and ADR, enabling you to evaluate performance in full context.
What Is Each KPI Actually Telling You?
When Revenue Loss Does Not Equal a Pricing Issue
Low revenue combined with low occupancy is often misdiagnosed as a pricing problem. However, it usually points to a structural issue, such as limited availability, weak listing quality, or restrictive booking policies.
Dropping rates in these situations rarely fixes the problem. If the unit isn’t converting or isn’t visible, lower pricing simply reduces potential revenue without addressing the root cause. The smarter move is to investigate availability, distribution, and listing performance before touching price.
When Occupancy Hides an ADR Problem
High occupancy can create a false sense of performance. A unit that consistently books may appear healthy, but if it does so at below-market rates, it is underperforming.
Reading occupancy and ADR together is essential, as revenue depends on both pricing and demand. Properties that fail to optimize rates in line with occupancy risk falling behind, even when booking volumes remain strong.
How Owner Usage Distorts Comparisons
Owner usage is one of the most common (and overlooked) distortions in performance analysis. Heavy owner blocks reduce available nights, which can make occupancy appear artificially high or low when compared to the market.
Without adjusting for owner blocks, you risk unfairly benchmarking a unit and making incorrect decisions. A property with significant owner stays may actually be performing in line with its comps on a per-available-night basis, even if headline occupancy looks weak.
What Do You Do When the Data Is Not Obvious?
Not every performance issue clearly shows up in the numbers. Sometimes, a unit may still lag behind despite revenue, occupancy, and ADR being aligned with the market.
When the KPI cascade doesn’t reveal a clear cause, the next step is to evaluate qualitative drivers of performance.
Reviews and Guest Feedback
Guest feedback often surfaces issues that KPIs cannot. Patterns in reviews, whether it’s cleanliness concerns, maintenance gaps, or mismatched expectations, can quietly suppress bookings even when pricing and availability are aligned.
Listing Quality
A well-priced unit can still underperform if it doesn’t convert. Photo quality, headline clarity, and description accuracy all play a direct role in whether a guest clicks and books.
In competitive markets, small differences in presentation can create a large gap in performance. Two comparable properties may have identical pricing and availability, but the one with stronger visuals and clear positioning will consistently outperform.
Amenity Mismatch
Positioning only works if the product supports it. A unit priced for a premium traveler profile but lacking expected amenities will struggle to compete, even if its KPIs appear aligned at a high level.
Comparing a unit’s amenity set against top-performing properties in the same segment can help you understand the gaps that aren’t obvious in revenue or occupancy data alone.
Marketing Exposure
If a unit isn’t distributed across the same channels or doesn’t have equivalent exposure, it will underperform regardless of pricing or quality.
Online bookings are expected to account for 83% of vacation rental revenue by 2027, underscoring that limited distribution can directly translate into lost demand.
How Do You Turn the KPI Cascade Into Action?
Pricing Changes
Pricing adjustments should never be the first move; they should be made only after data-backed confirmation. Adjust rates only when the cascade clearly identifies the ADR issue.
When pricing is the driver, changes should be targeted rather than general. Align rate adjustments with specific date ranges, booking windows, or stay patterns identified by the booking behavior analysis.
Marketing Pushes
Not every underperforming unit has a pricing problem; sometimes the issue is visibility. Units with solid occupancy and ADR relative to comps, but lower booking volume, often suffer from limited exposure rather than weak positioning.
Expanding channel distribution, improving placement on existing platforms, or running targeted campaigns can help you unlock demand that pricing alone cannot.
Owner Conversations
Owner usage is one of the few performance variables outside your property management team’s direct control, but it’s also one of the most impactful. When owner blocks reduce availability, they directly limit revenue potential, regardless of pricing or demand.
The KPI cascade provides the structure needed to have these conversations with confidence. Instead of general recommendations, you can present benchmarked, data-backed scenarios that show the revenue opportunity tied to increased availability.
KeyData helps you generate clear, visual unit-level performance reports, providing the verified data you need to communicate performance transparently and align with owners on the best path forward.
Great Revenue Managers Diagnose – They Do Not Guess
Strong portfolios aren’t built on faster reactions, but on better diagnosis.
The KPI cascade transforms performance analysis from an instinct-driven process into a repeatable, defensible framework.
By starting at the portfolio level, narrowing down through each KPI, and validating findings with context, you can move from assumptions to evidence with clarity.
Performance gaps are rarely obvious, and even small inefficiencies can scale quickly across large portfolios. Having access to the right data and knowing how to interpret it with precision has a significant impact.
KeyData provides accurate, direct-source data and benchmarking insights, equipping your teams with the visibility they need to diagnose issues and validate strategies.
Request a demo today to begin the KPI cascade. See how ProData's leaderboard and benchmarking tools can make your portfolio diagnosis faster and more defensible.